| Red | Green | Blue | |
| z | 17.64 | ||
| znorm | Inf | ||
| sky | -Inf | -Inf | -Inf |
| S/N | 28.1 | 47.3 | 53.9 |
| S/N(c) | 0.0 | 0.0 | 0.0 |
| SN(E/C) |
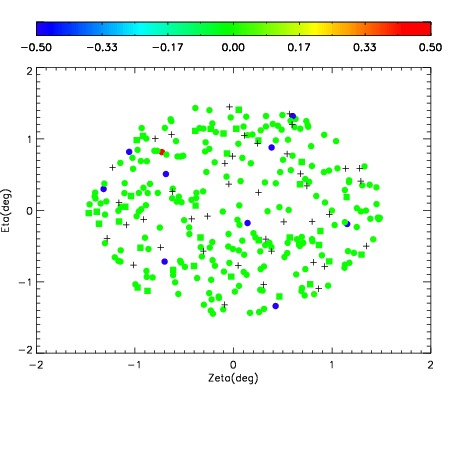
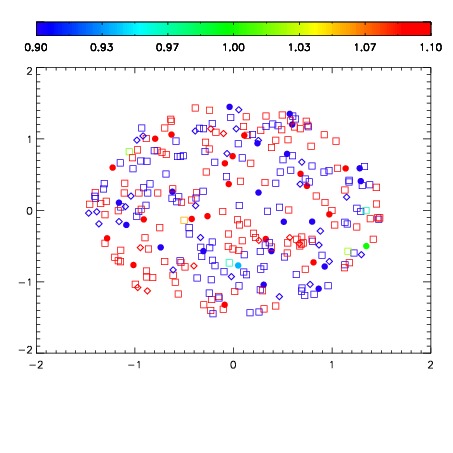
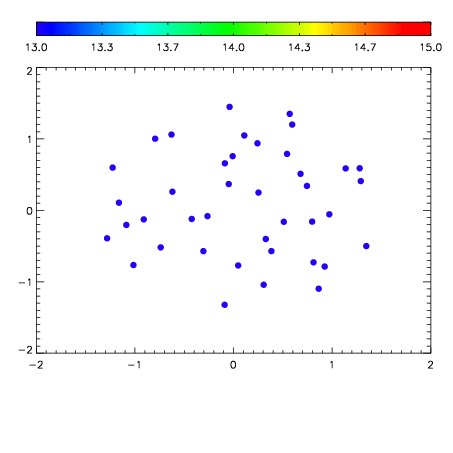

| Frame | Nreads | Zeropoints | Mag plots | Spatial mag deviation | Spatial sky 16325A emission deviations (filled: sky, open: star) | Spatial sky continuum emission | Spatial sky telluric CO2 absorption deviations (filled: H < 10) | |||||||||||||||||||||||
| 0 | 0 |
|
|
|
|
|
|
| IPAIR | NAME | SHIFT | NEWSHIFT | S/N | NAME | SHIFT | NEWSHIFT | S/N |
| 0 | 08470051 | 0.486641 | 0.00000 | 225.888 | 08470049 | 0.00158301 | 0.485058 | 226.882 |
| 1 | 08470046 | 0.483409 | 0.00323200 | 230.738 | 08470045 | 0.00000 | 0.486641 | 231.037 |
| 2 | 08470050 | 0.485453 | 0.00118798 | 225.872 | 08470052 | 0.00174145 | 0.484900 | 225.854 |
| 3 | 08470047 | 0.485213 | 0.00142798 | 220.659 | 08470048 | 0.00353057 | 0.483110 | 225.308 |