| Red | Green | Blue | |
| z | 17.64 | ||
| znorm | Inf | ||
| sky | -Inf | -Inf | -Inf |
| S/N | 29.2 | 51.2 | 54.5 |
| S/N(c) | 0.0 | 0.0 | 0.0 |
| SN(E/C) |
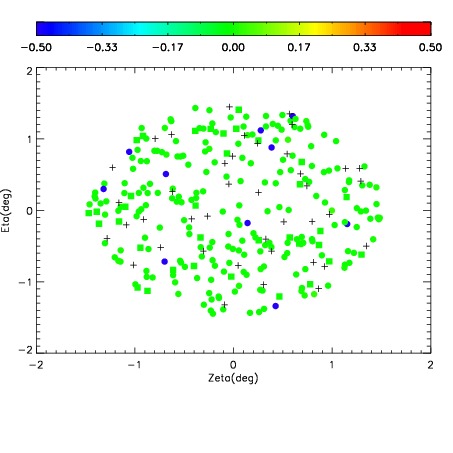

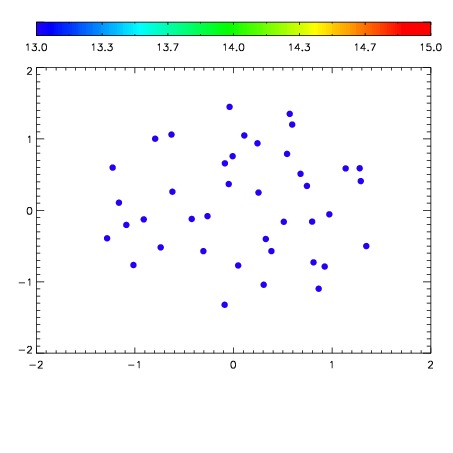

| Frame | Nreads | Zeropoints | Mag plots | Spatial mag deviation | Spatial sky 16325A emission deviations (filled: sky, open: star) | Spatial sky continuum emission | Spatial sky telluric CO2 absorption deviations (filled: H < 10) | |||||||||||||||||||||||
| 0 | 0 |
|
|
|
|
|
|
| IPAIR | NAME | SHIFT | NEWSHIFT | S/N | NAME | SHIFT | NEWSHIFT | S/N |
| 0 | 11940038 | 0.498730 | 0.00000 | 242.732 | 11940041 | -0.00453888 | 0.503269 | 240.366 |
| 1 | 11940039 | 0.498187 | 0.000542998 | 245.191 | 11940044 | -0.00543436 | 0.504164 | 245.456 |
| 2 | 11940042 | 0.495867 | 0.00286299 | 244.724 | 11940037 | 0.00000 | 0.498730 | 243.038 |
| 3 | 11940043 | 0.495996 | 0.00273401 | 244.624 | 11940040 | -0.00350181 | 0.502232 | 240.684 |