| Red | Green | Blue | |
| z | 17.64 | ||
| znorm | Inf | ||
| sky | -Inf | -NaN | -Inf |
| S/N | 28.0 | 48.5 | 53.9 |
| S/N(c) | 0.0 | 0.0 | 0.0 |
| SN(E/C) |

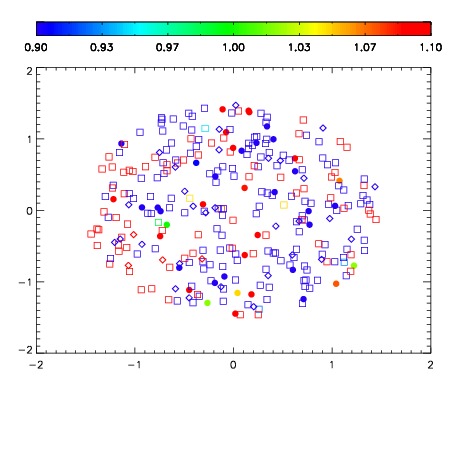
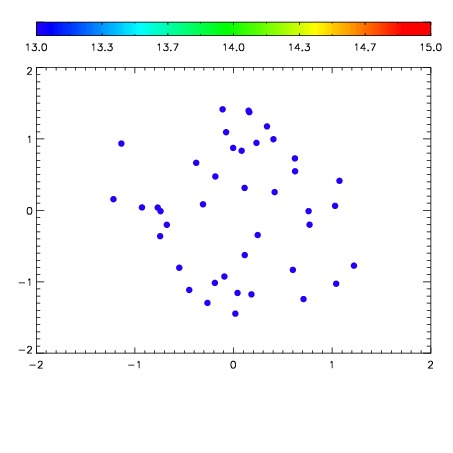

| Frame | Nreads | Zeropoints | Mag plots | Spatial mag deviation | Spatial sky 16325A emission deviations (filled: sky, open: star) | Spatial sky continuum emission | Spatial sky telluric CO2 absorption deviations (filled: H < 10) | |||||||||||||||||||||||
| 0 | 0 |
|
|
|
|
|
|
| IPAIR | NAME | SHIFT | NEWSHIFT | S/N | NAME | SHIFT | NEWSHIFT | S/N |
| 0 | 04370031 | 0.491776 | 0.00000 | 239.392 | 04370029 | -0.00117073 | 0.492947 | 238.610 |
| 1 | 04370026 | 0.490531 | 0.00124499 | 239.620 | 04370032 | 0.000472904 | 0.491303 | 240.855 |
| 2 | 04370027 | 0.491495 | 0.000280976 | 238.167 | 04370028 | 0.000963810 | 0.490812 | 238.556 |
| 3 | 04370030 | 0.489904 | 0.00187200 | 238.096 | 04370025 | 0.00000 | 0.491776 | 235.488 |