| Red | Green | Blue | |
| z | 17.64 | ||
| znorm | Inf | ||
| sky | -Inf | -Inf | -Inf |
| S/N | 28.0 | 48.8 | 55.3 |
| S/N(c) | 0.0 | 0.0 | 0.0 |
| SN(E/C) |
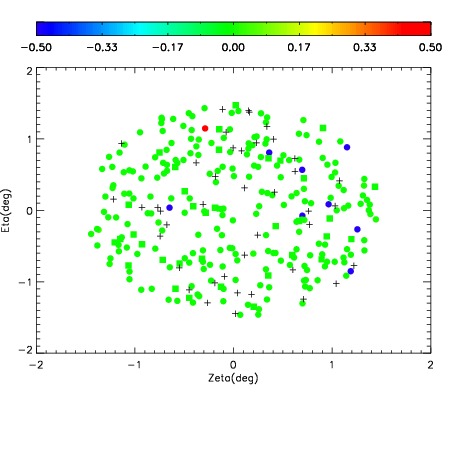
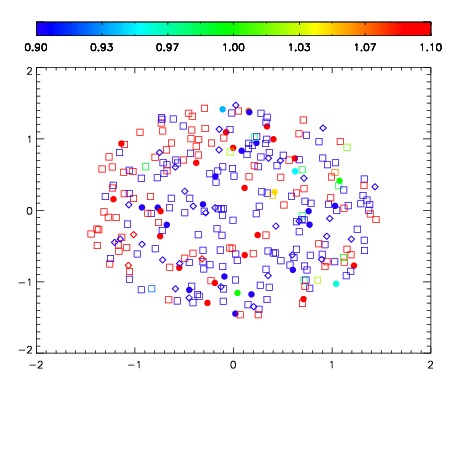
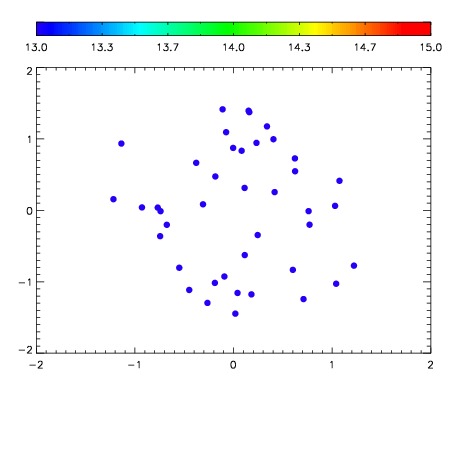

| Frame | Nreads | Zeropoints | Mag plots | Spatial mag deviation | Spatial sky 16325A emission deviations (filled: sky, open: star) | Spatial sky continuum emission | Spatial sky telluric CO2 absorption deviations (filled: H < 10) | |||||||||||||||||||||||
| 0 | 0 |
|
|
|
|
|
|
| IPAIR | NAME | SHIFT | NEWSHIFT | S/N | NAME | SHIFT | NEWSHIFT | S/N |
| 0 | 04560060 | 0.498906 | 0.00000 | 264.202 | 04560065 | -0.00247998 | 0.501386 | 264.353 |
| 1 | 04560063 | 0.498275 | 0.000630975 | 266.034 | 04560062 | -0.00314471 | 0.502051 | 267.115 |
| 2 | 04560064 | 0.498760 | 0.000145972 | 265.847 | 04560061 | 3.69756e-05 | 0.498869 | 265.558 |
| 3 | 04560059 | 0.498589 | 0.000316978 | 263.108 | 04560058 | 0.00000 | 0.498906 | 261.176 |