| Red | Green | Blue | |
| z | 17.64 | ||
| znorm | Inf | ||
| sky | -Inf | -Inf | -Inf |
| S/N | 18.6 | 35.5 | 42.1 |
| S/N(c) | 0.0 | 0.0 | 0.0 |
| SN(E/C) |
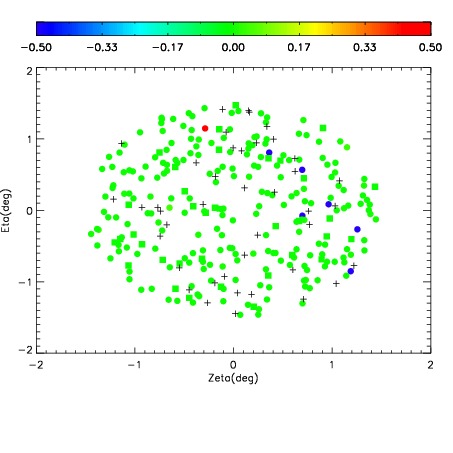
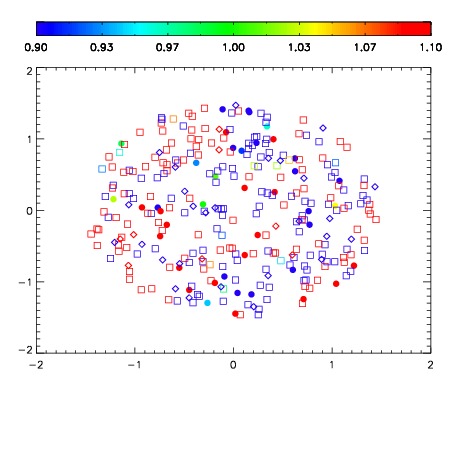
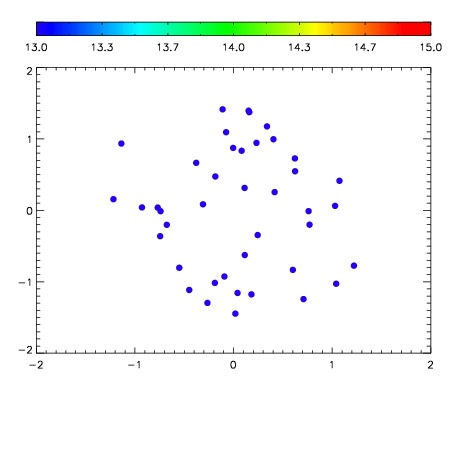

| Frame | Nreads | Zeropoints | Mag plots | Spatial mag deviation | Spatial sky 16325A emission deviations (filled: sky, open: star) | Spatial sky continuum emission | Spatial sky telluric CO2 absorption deviations (filled: H < 10) | |||||||||||||||||||||||
| 0 | 0 |
|
|
|
|
|
|
| IPAIR | NAME | SHIFT | NEWSHIFT | S/N | NAME | SHIFT | NEWSHIFT | S/N |
| 0 | 07830088 | 0.472133 | 0.00000 | 197.574 | 07830082 | 0.00000 | 0.472133 | 197.926 |
| 1 | 07830087 | 0.471255 | 0.000878006 | 196.253 | 07830086 | -0.000978784 | 0.473112 | 197.646 |
| 2 | 07830084 | 0.470868 | 0.00126502 | 195.914 | 07830085 | -0.000548815 | 0.472682 | 193.492 |
| 3 | 07830083 | 0.471037 | 0.00109601 | 188.234 | 07830089 | 0.00155492 | 0.470578 | 192.349 |