| Red | Green | Blue | |
| z | 17.64 | ||
| znorm | Inf | ||
| sky | -Inf | -NaN | -Inf |
| S/N | 22.5 | 40.3 | 43.6 |
| S/N(c) | 0.0 | 0.0 | 0.0 |
| SN(E/C) |
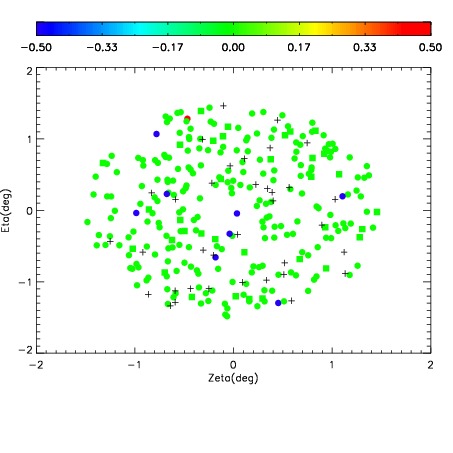
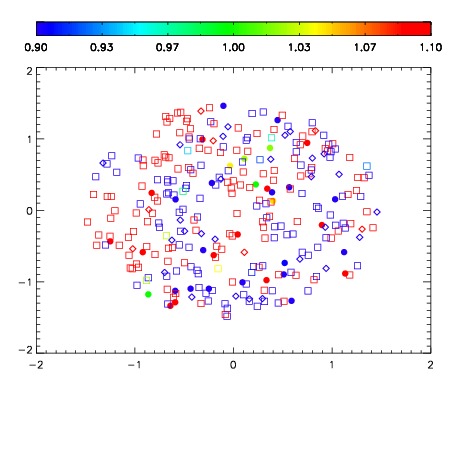
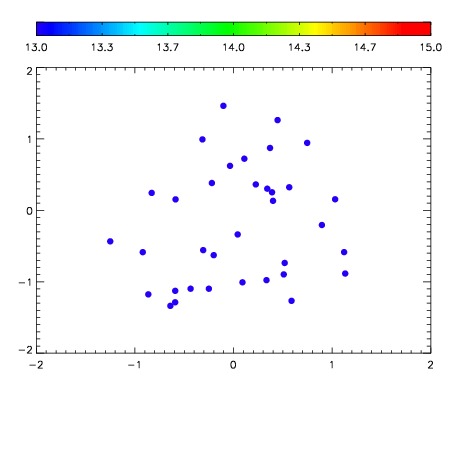

| Frame | Nreads | Zeropoints | Mag plots | Spatial mag deviation | Spatial sky 16325A emission deviations (filled: sky, open: star) | Spatial sky continuum emission | Spatial sky telluric CO2 absorption deviations (filled: H < 10) | |||||||||||||||||||||||
| 0 | 0 |
|
|
|
|
|
|
| IPAIR | NAME | SHIFT | NEWSHIFT | S/N | NAME | SHIFT | NEWSHIFT | S/N |
| 0 | 11400076 | 0.474969 | 0.00000 | 202.226 | 11400077 | 0.000599208 | 0.474370 | 195.336 |
| 1 | 11400080 | 0.474528 | 0.000440985 | 216.097 | 11400074 | 0.00000 | 0.474969 | 215.637 |
| 2 | 11400075 | 0.474172 | 0.000797004 | 215.882 | 11400081 | 0.000801139 | 0.474168 | 210.187 |
| 3 | 11400079 | 0.474933 | 3.60012e-05 | 209.366 | 11400078 | 0.00165806 | 0.473311 | 200.568 |