| Red | Green | Blue | |
| z | 17.64 | ||
| znorm | Inf | ||
| sky | -Inf | -Inf | -Inf |
| S/N | 23.7 | 42.9 | 46.5 |
| S/N(c) | 0.0 | 0.0 | 0.0 |
| SN(E/C) |
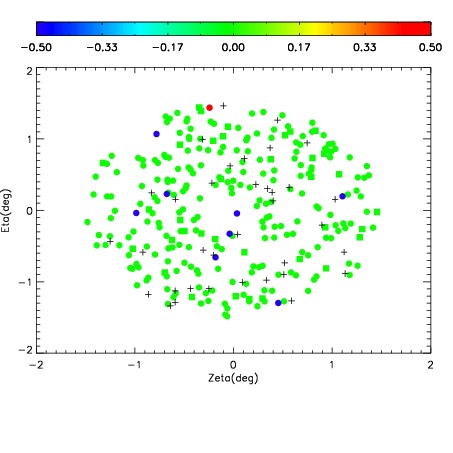
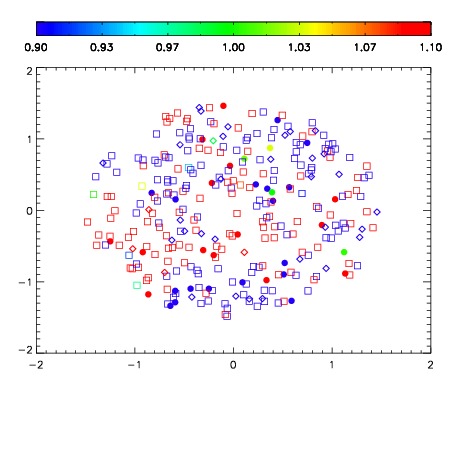
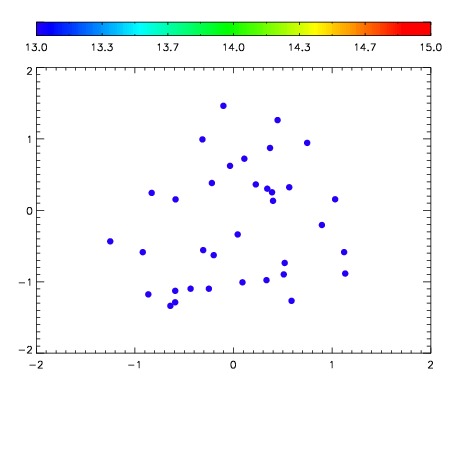

| Frame | Nreads | Zeropoints | Mag plots | Spatial mag deviation | Spatial sky 16325A emission deviations (filled: sky, open: star) | Spatial sky continuum emission | Spatial sky telluric CO2 absorption deviations (filled: H < 10) | |||||||||||||||||||||||
| 0 | 0 |
|
|
|
|
|
|
| IPAIR | NAME | SHIFT | NEWSHIFT | S/N | NAME | SHIFT | NEWSHIFT | S/N |
| 0 | 11710061 | 0.485885 | 0.00000 | 220.943 | 11710062 | -0.00354862 | 0.489434 | 222.609 |
| 1 | 11710065 | 0.484108 | 0.00177699 | 225.888 | 11710066 | -0.00511145 | 0.490996 | 231.793 |
| 2 | 11710064 | 0.483295 | 0.00259000 | 220.971 | 11710063 | -0.00464463 | 0.490530 | 223.668 |
| 3 | 11710060 | 0.485736 | 0.000148982 | 208.823 | 11710059 | 0.00000 | 0.485885 | 199.598 |