| Red | Green | Blue | |
| z | 17.64 | ||
| znorm | Inf | ||
| sky | -Inf | -NaN | -Inf |
| S/N | 30.2 | 50.1 | 55.3 |
| S/N(c) | 0.0 | 0.0 | 0.0 |
| SN(E/C) |
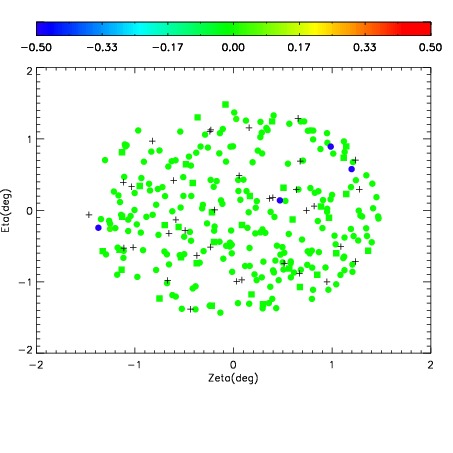
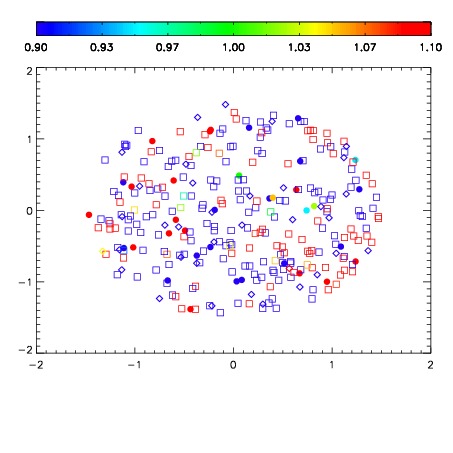
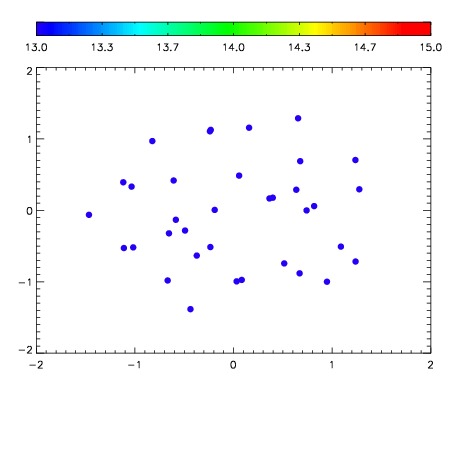

| Frame | Nreads | Zeropoints | Mag plots | Spatial mag deviation | Spatial sky 16325A emission deviations (filled: sky, open: star) | Spatial sky continuum emission | Spatial sky telluric CO2 absorption deviations (filled: H < 10) | |||||||||||||||||||||||
| 0 | 0 |
|
|
|
|
|
|
| IPAIR | NAME | SHIFT | NEWSHIFT | S/N | NAME | SHIFT | NEWSHIFT | S/N |
| 0 | 11940076 | 0.496639 | 0.00000 | 186.623 | 11940077 | -0.00335505 | 0.499994 | 188.794 |
| 1 | 11940075 | 0.495678 | 0.000961006 | 187.671 | 11940073 | -0.00347738 | 0.500116 | 189.184 |
| 2 | 11940072 | 0.494912 | 0.00172701 | 186.471 | 11940074 | -0.00280818 | 0.499447 | 187.193 |
| 3 | 11940071 | 0.494674 | 0.00196502 | 186.156 | 11940070 | 0.00000 | 0.496639 | 175.154 |