| Red | Green | Blue | |
| z | 17.64 | ||
| znorm | Inf | ||
| sky | -Inf | -Inf | -Inf |
| S/N | 21.8 | 40.8 | 43.1 |
| S/N(c) | 0.0 | 0.0 | 0.0 |
| SN(E/C) |
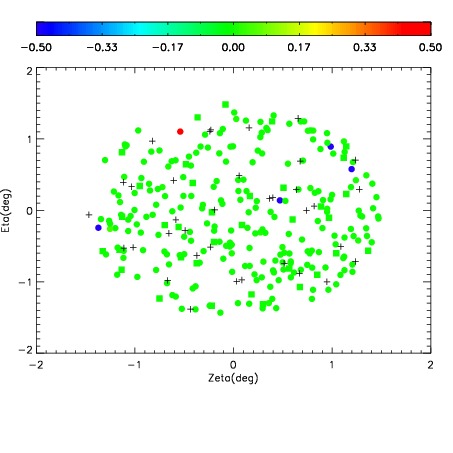
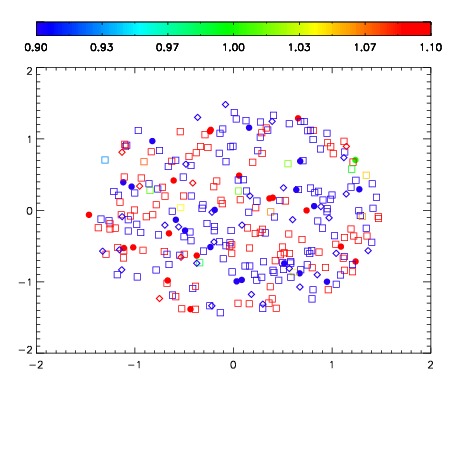
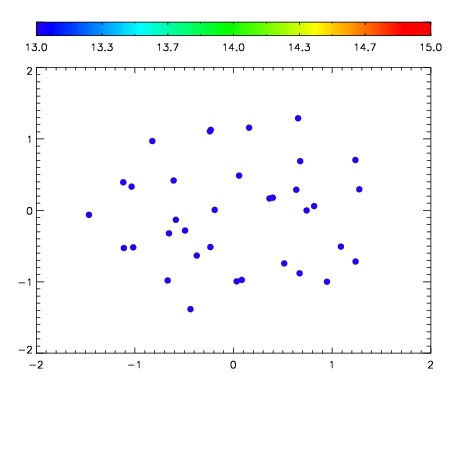

| Frame | Nreads | Zeropoints | Mag plots | Spatial mag deviation | Spatial sky 16325A emission deviations (filled: sky, open: star) | Spatial sky continuum emission | Spatial sky telluric CO2 absorption deviations (filled: H < 10) | |||||||||||||||||||||||
| 0 | 0 |
|
|
|
|
|
|
| IPAIR | NAME | SHIFT | NEWSHIFT | S/N | NAME | SHIFT | NEWSHIFT | S/N |
| 0 | 12230017 | 0.495534 | 0.00000 | 167.714 | 12230018 | -0.00351605 | 0.499050 | 175.646 |
| 1 | 12230016 | 0.495425 | 0.000109017 | 162.238 | 12230015 | -0.00304766 | 0.498582 | 163.018 |
| 2 | 12230012 | 0.493863 | 0.00167102 | 153.984 | 12230014 | -0.00316235 | 0.498696 | 158.749 |
| 3 | 12230013 | 0.493599 | 0.00193501 | 152.389 | 12230011 | 0.00000 | 0.495534 | 146.596 |