| Red | Green | Blue | |
| z | 17.64 | ||
| znorm | Inf | ||
| sky | -Inf | -Inf | -Inf |
| S/N | 27.1 | 46.6 | 50.0 |
| S/N(c) | 0.0 | 0.0 | 0.0 |
| SN(E/C) |
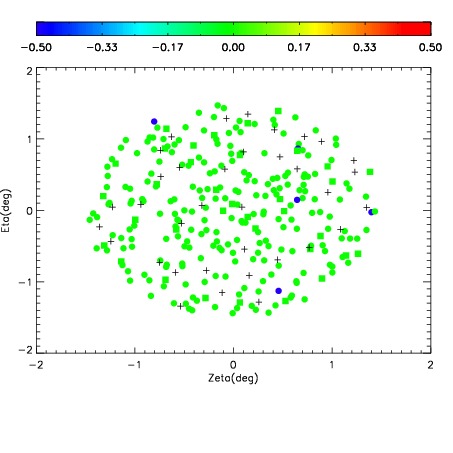
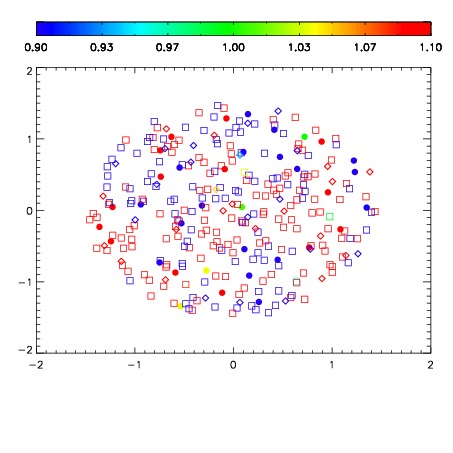
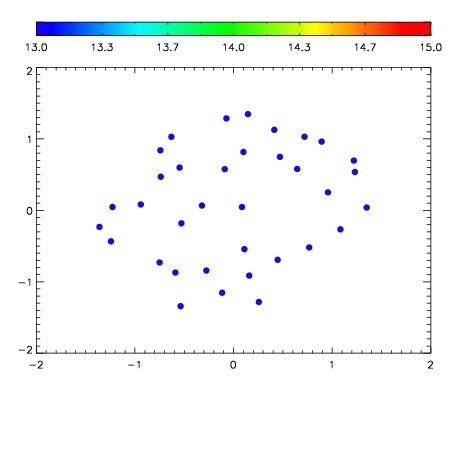

| Frame | Nreads | Zeropoints | Mag plots | Spatial mag deviation | Spatial sky 16325A emission deviations (filled: sky, open: star) | Spatial sky continuum emission | Spatial sky telluric CO2 absorption deviations (filled: H < 10) | |||||||||||||||||||||||
| 0 | 0 |
|
|
|
|
|
|
| IPAIR | NAME | SHIFT | NEWSHIFT | S/N | NAME | SHIFT | NEWSHIFT | S/N |
| 0 | 05230016 | 0.493970 | 0.00000 | 267.450 | 05230014 | 0.000922665 | 0.493047 | 268.861 |
| 1 | 05230015 | 0.493883 | 8.69930e-05 | 268.847 | 05230017 | 0.00215416 | 0.491816 | 271.277 |
| 2 | 05230011 | 0.493091 | 0.000879019 | 261.028 | 05230013 | 0.00103803 | 0.492932 | 265.018 |
| 3 | 05230012 | 0.493501 | 0.000468999 | 260.027 | 05230010 | 0.00000 | 0.493970 | 262.186 |