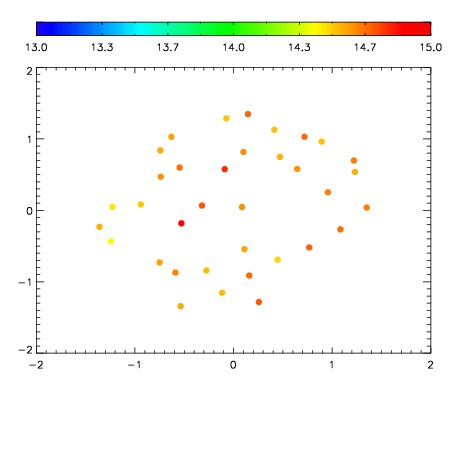
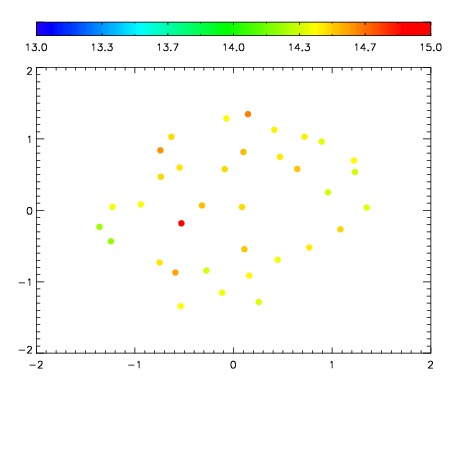
| Frame | Nreads | Zeropoints | Mag plots
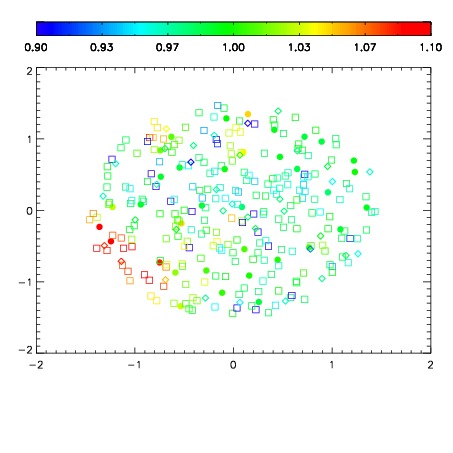
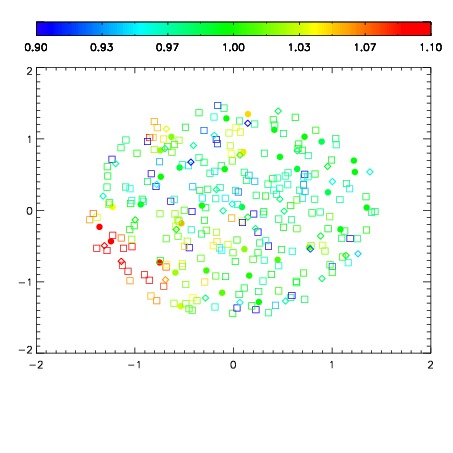
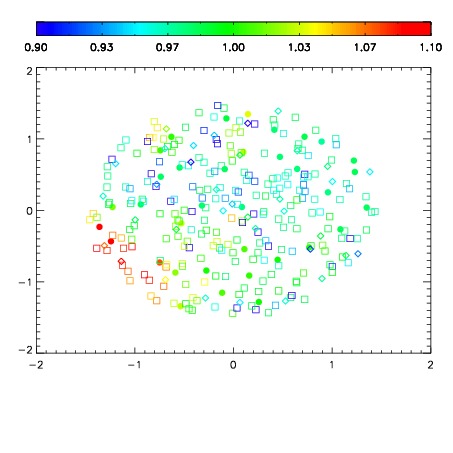
| Spatial mag deviation
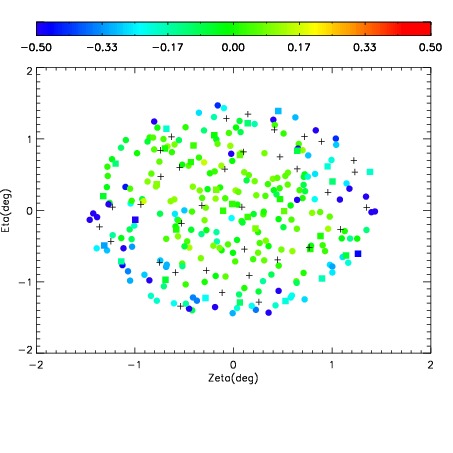
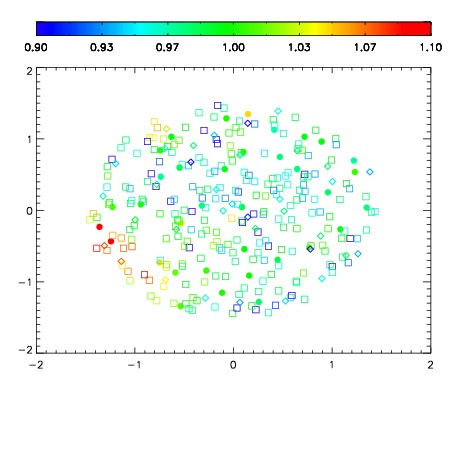
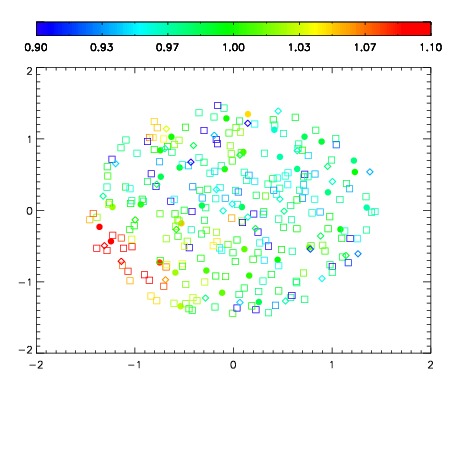
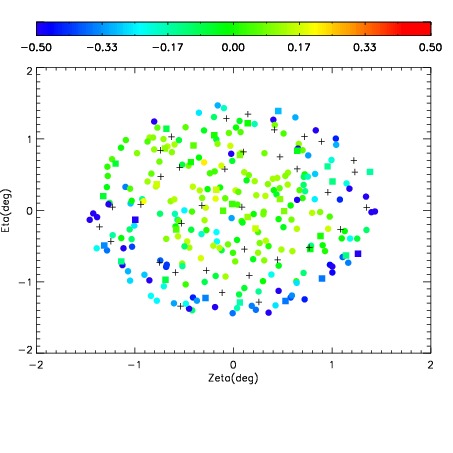
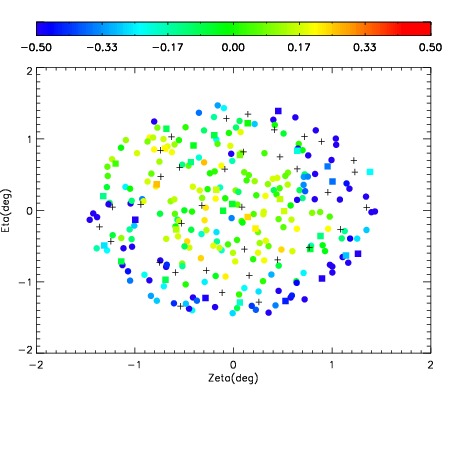
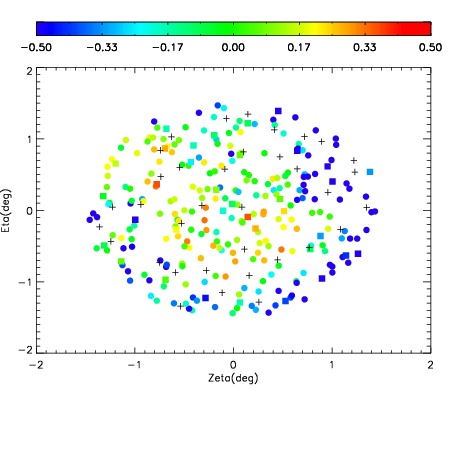
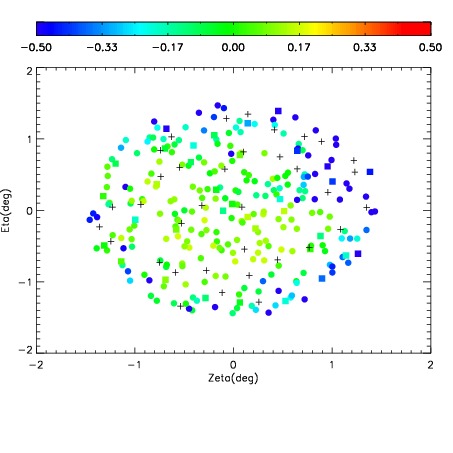
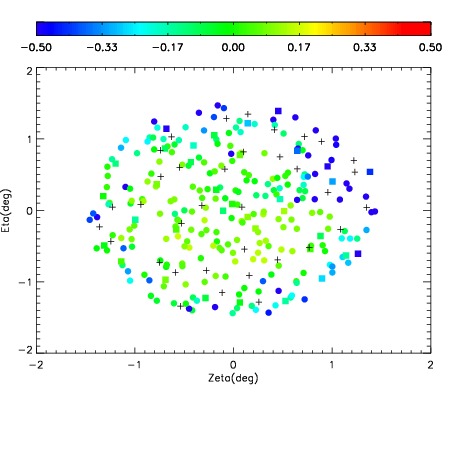
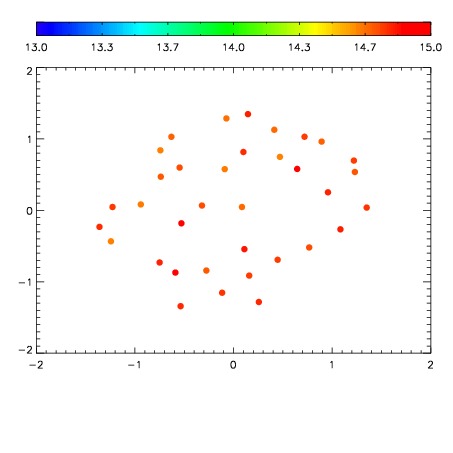
| Spatial sky 16325A emission deviations (filled: sky, open: star)
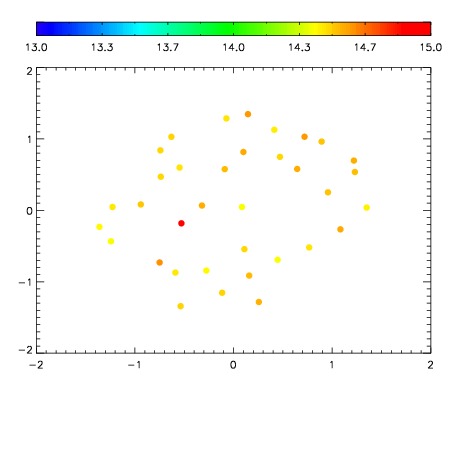
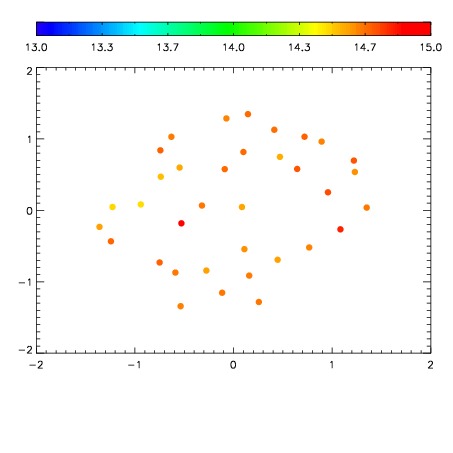
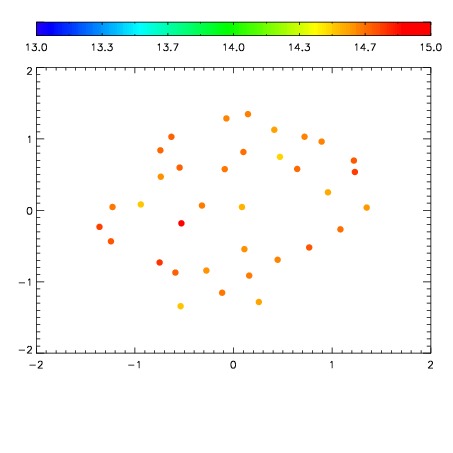
| Spatial sky continuum emission
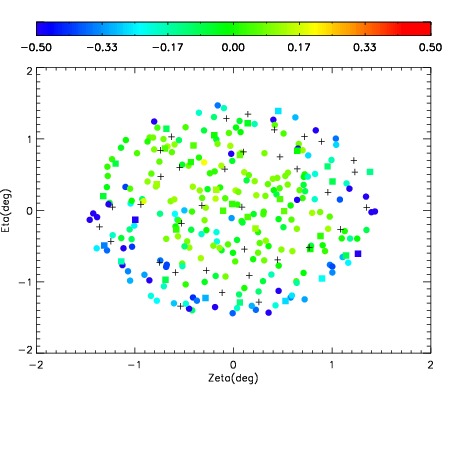
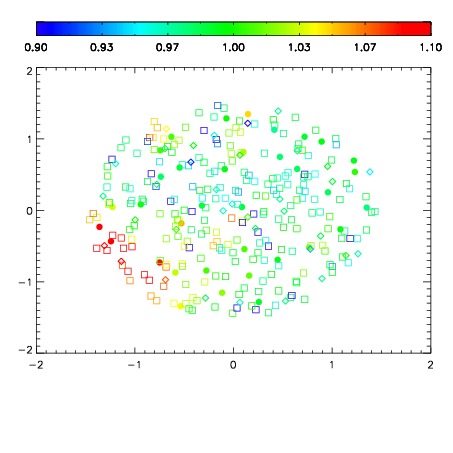
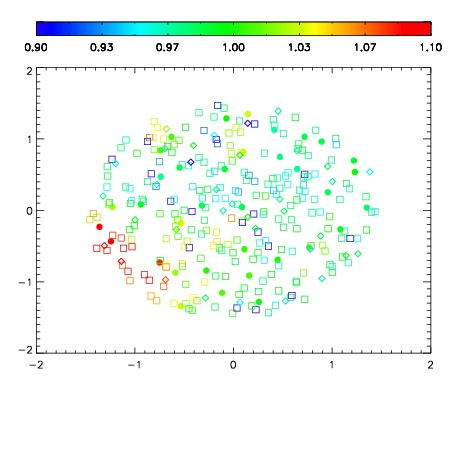
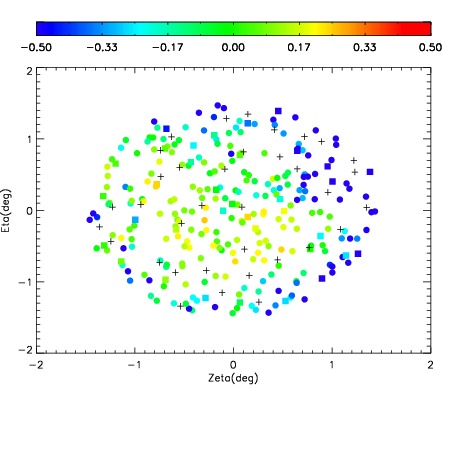
| Spatial sky telluric CO2 absorption deviations (filled: H < 10)
|
| 11760032
| 47
| | Red | Green | Blue
| | z | | 18.63
| | znorm | | 14.45
| | sky | 14.8 | 14.5 | 14.5
| | S/N | 11.4 | 19.4 | 21.2
| | S/N(c) | 10.0 | 18.2 | 19.9
| | SN(E/C) 0.42
|
| 
| 
| 
| 
| 
|
| 11760033
| 47
| | Red | Green | Blue
| | z | | 18.64
| | znorm | | 14.46
| | sky | 14.9 | 14.6 | 14.7
| | S/N | 11.4 | 19.9 | 21.4
| | S/N(c) | 9.9 | 18.3 | 20.2
| | SN(E/C) 0.40
|
| 
| 
| 
| 
| 
|
| 11760034
| 47
| | Red | Green | Blue
| | z | | 18.35
| | znorm | | 14.17
| | sky | 14.6 | 14.4 | 14.8
| | S/N | 9.5 | 16.8 | 18.0
| | S/N(c) | 8.3 | 15.5 | 16.9
| | SN(E/C) 0.46
|
| 
| 
| 
| 
| 
|
| 11760035
| 47
| | Red | Green | Blue
| | z | | 18.25
| | znorm | | 14.07
| | sky | 14.6 | 14.5 | 14.8
| | S/N | 8.2 | 15.0 | 16.6
| | S/N(c) | 7.3 | 13.6 | 15.8
| | SN(E/C) 0.50
|
| 
| 
| 
| 
| 
|
| 11760036
| 47
| | Red | Green | Blue
| | z | | 18.25
| | znorm | | 14.07
| | sky | 14.6 | 14.5 | 14.8
| | S/N | 7.8 | 14.8 | 16.0
| | S/N(c) | 6.9 | 13.5 | 15.2
| | SN(E/C) 0.54
|
| 
| 
| 
| 
| 
|
| 11760037
| 47
| | Red | Green | Blue
| | z | | 18.41
| | znorm | | 14.23
| | sky | 14.8 | 14.7 | 14.8
| | S/N | 9.6 | 16.9 | 18.5
| | S/N(c) | 8.4 | 15.5 | 17.3
| | SN(E/C) 0.51
|
| 
| 
| 
| 
| 
|
| 11760038
| 47
| | Red | Green | Blue
| | z | | 18.53
| | znorm | | 14.35
| | sky | 14.6 | 14.7 | 15.0
| | S/N | 10.5 | 18.1 | 19.6
| | S/N(c) | 9.2 | 16.5 | 18.2
| | SN(E/C) 0.47
|
| 
| 
| 
| 
| 
|
| 11760039
| 47
| | Red | Green | Blue
| | z | | 18.63
| | znorm | | 14.45
| | sky | 14.9 | 14.8 | 14.8
| | S/N | 11.6 | 19.5 | 21.7
| | S/N(c) | 10.3 | 17.9 | 20.3
| | SN(E/C) 0.41
|
| 
| 
| 
| 
| 
|