| Red | Green | Blue | |
| z | 17.64 | ||
| znorm | Inf | ||
| sky | -Inf | -Inf | -Inf |
| S/N | 17.4 | 33.0 | 36.0 |
| S/N(c) | 0.0 | 0.0 | 0.0 |
| SN(E/C) |
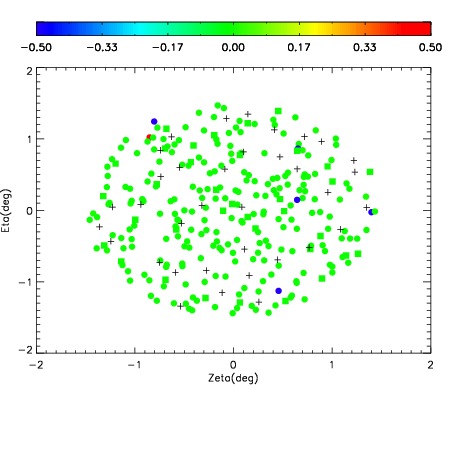
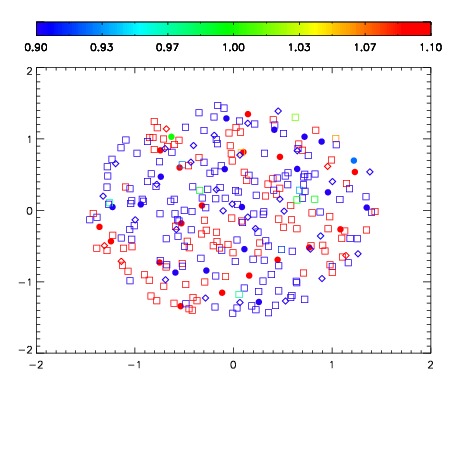
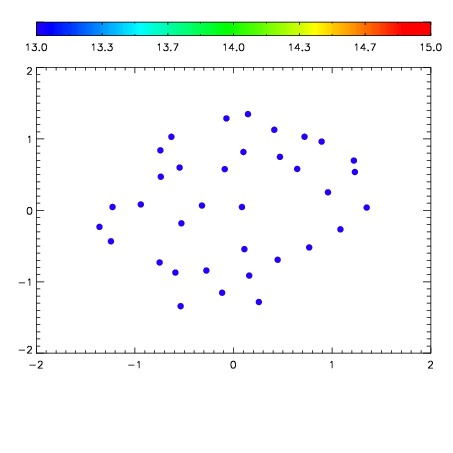

| Frame | Nreads | Zeropoints | Mag plots | Spatial mag deviation | Spatial sky 16325A emission deviations (filled: sky, open: star) | Spatial sky continuum emission | Spatial sky telluric CO2 absorption deviations (filled: H < 10) | |||||||||||||||||||||||
| 0 | 0 |
|
|
|
|
|
|
| IPAIR | NAME | SHIFT | NEWSHIFT | S/N | NAME | SHIFT | NEWSHIFT | S/N |
| 0 | 11760033 | 0.494555 | 0.00000 | 211.382 | 11760032 | 0.00000 | 0.494555 | 209.994 |
| 1 | 11760038 | 0.493239 | 0.00131601 | 201.029 | 11760039 | -0.00451093 | 0.499066 | 209.462 |
| 2 | 11760037 | 0.493495 | 0.00106001 | 192.981 | 11760036 | -0.00178243 | 0.496337 | 178.625 |
| 3 | 11760034 | 0.494551 | 3.99351e-06 | 186.252 | 11760035 | -0.00207342 | 0.496628 | 177.703 |