| Red | Green | Blue | |
| z | 17.64 | ||
| znorm | Inf | ||
| sky | -Inf | -Inf | -Inf |
| S/N | 19.9 | 34.9 | 41.7 |
| S/N(c) | 0.0 | 0.0 | 0.0 |
| SN(E/C) |
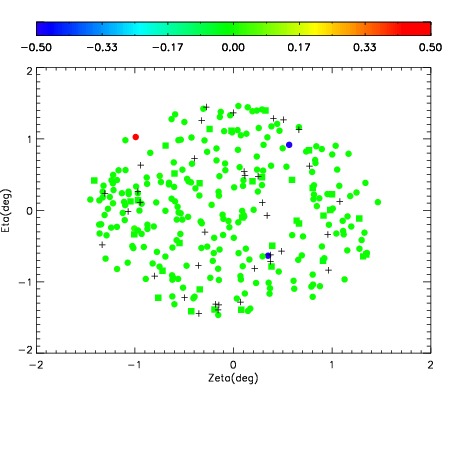
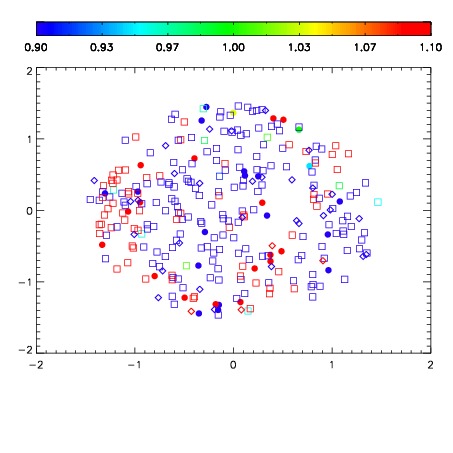
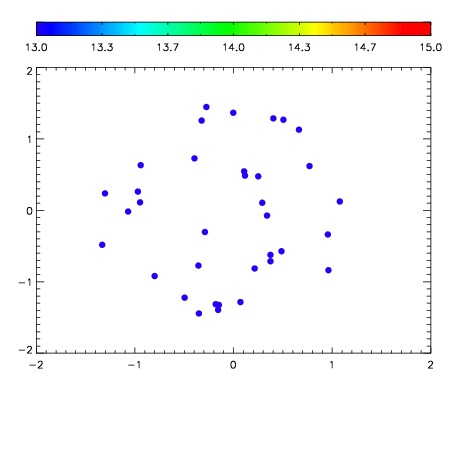

| Frame | Nreads | Zeropoints | Mag plots | Spatial mag deviation | Spatial sky 16325A emission deviations (filled: sky, open: star) | Spatial sky continuum emission | Spatial sky telluric CO2 absorption deviations (filled: H < 10) | |||||||||||||||||||||||
| 0 | 0 |
|
|
|
|
|
|
| IPAIR | NAME | SHIFT | NEWSHIFT | S/N | NAME | SHIFT | NEWSHIFT | S/N |
| 0 | 11730067 | 0.489758 | 0.00000 | 98.3119 | 11730066 | 0.00000 | 0.489758 | 99.0524 |
| 1 | 11730068 | 0.489424 | 0.000334024 | 98.9895 | 11730073 | -0.00480072 | 0.494559 | 103.067 |
| 2 | 11730072 | 0.489746 | 1.20103e-05 | 89.2468 | 11730070 | -0.00150819 | 0.491266 | 89.4212 |
| 3 | 11730071 | 0.489042 | 0.000716001 | 82.0369 | 11730069 | -0.00121674 | 0.490975 | 72.7984 |