| Red | Green | Blue | |
| z | 17.64 | ||
| znorm | Inf | ||
| sky | -Inf | -Inf | -Inf |
| S/N | 28.2 | 47.4 | 50.8 |
| S/N(c) | 0.0 | 0.0 | 0.0 |
| SN(E/C) |
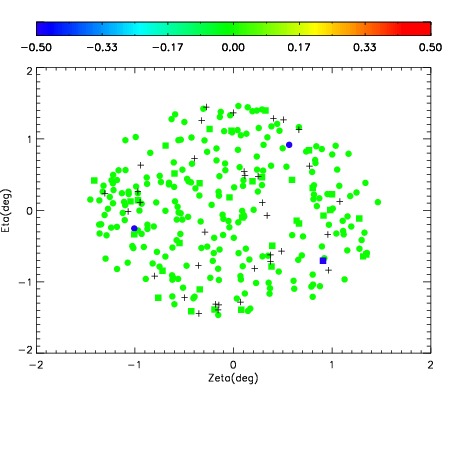
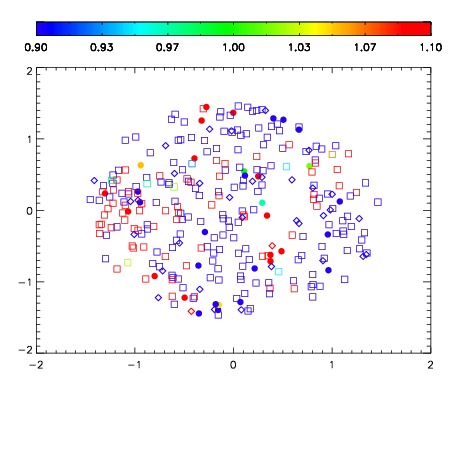


| Frame | Nreads | Zeropoints | Mag plots | Spatial mag deviation | Spatial sky 16325A emission deviations (filled: sky, open: star) | Spatial sky continuum emission | Spatial sky telluric CO2 absorption deviations (filled: H < 10) | |||||||||||||||||||||||
| 0 | 0 |
|
|
|
|
|
|
| IPAIR | NAME | SHIFT | NEWSHIFT | S/N | NAME | SHIFT | NEWSHIFT | S/N |
| 0 | 11780013 | 0.488539 | 0.00000 | 189.319 | 11780018 | -0.00388421 | 0.492423 | 172.715 |
| 1 | 11780012 | 0.487697 | 0.000842005 | 201.825 | 11780011 | 0.00000 | 0.488539 | 207.283 |
| 2 | 11780017 | 0.486452 | 0.00208700 | 173.769 | 11780014 | -0.00366641 | 0.492205 | 167.657 |
| 3 | 11780016 | 0.486928 | 0.00161102 | 163.563 | 11780015 | -0.00353956 | 0.492079 | 153.163 |