| Red | Green | Blue | |
| z | 17.64 | ||
| znorm | Inf | ||
| sky | -NaN | -Inf | -Inf |
| S/N | 26.5 | 45.9 | 52.5 |
| S/N(c) | 0.0 | 0.0 | 0.0 |
| SN(E/C) |
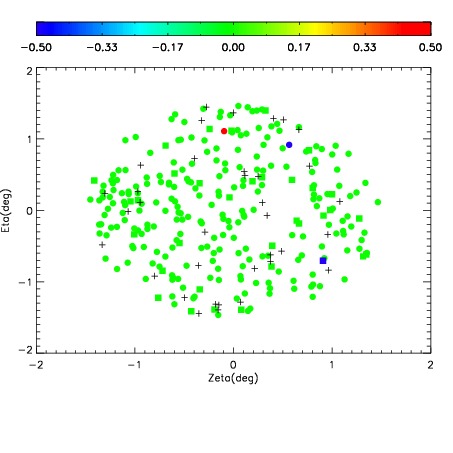
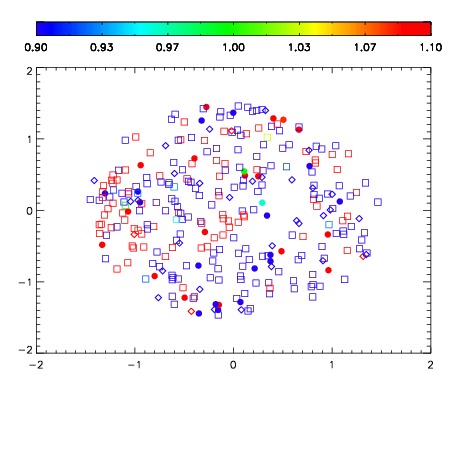
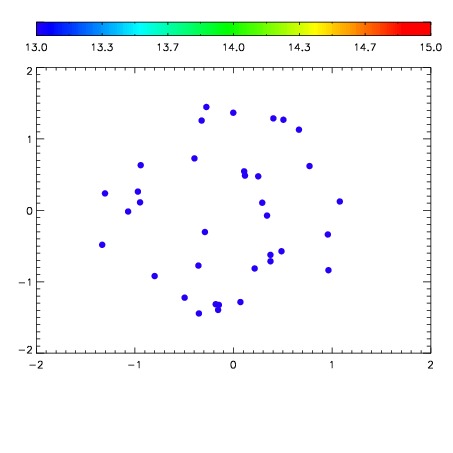

| Frame | Nreads | Zeropoints | Mag plots | Spatial mag deviation | Spatial sky 16325A emission deviations (filled: sky, open: star) | Spatial sky continuum emission | Spatial sky telluric CO2 absorption deviations (filled: H < 10) | |||||||||||||||||||||||
| 0 | 0 |
|
|
|
|
|
|
| IPAIR | NAME | SHIFT | NEWSHIFT | S/N | NAME | SHIFT | NEWSHIFT | S/N |
| 0 | 12000046 | 0.498541 | 0.00000 | 170.156 | 12000044 | 0.00000 | 0.498541 | 163.860 |
| 1 | 12000050 | 0.498277 | 0.000263989 | 181.120 | 12000051 | -0.00334004 | 0.501881 | 185.588 |
| 2 | 12000049 | 0.497534 | 0.00100699 | 178.485 | 12000048 | -0.00228835 | 0.500829 | 177.360 |
| 3 | 12000045 | 0.497805 | 0.000735998 | 170.386 | 12000047 | -0.00226997 | 0.500811 | 175.823 |