| Red | Green | Blue | |
| z | 17.64 | ||
| znorm | Inf | ||
| sky | -Inf | -Inf | -Inf |
| S/N | 27.5 | 48.1 | 53.4 |
| S/N(c) | 0.0 | 0.0 | 0.0 |
| SN(E/C) |
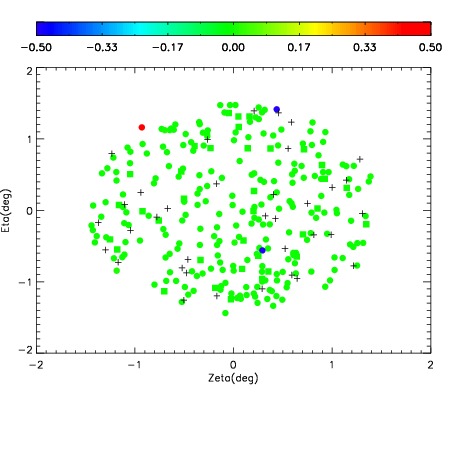
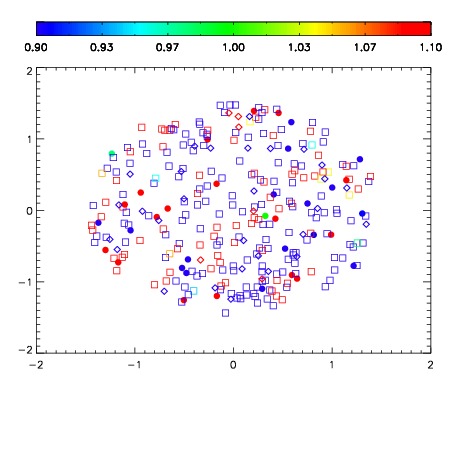
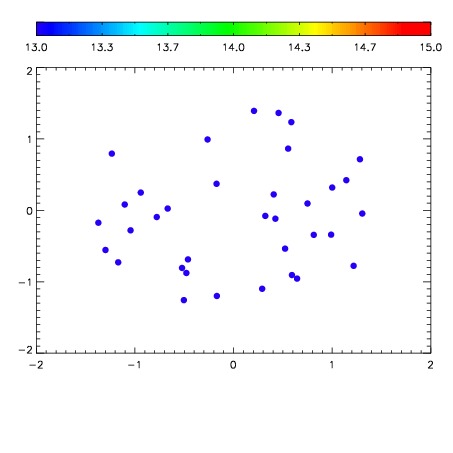

| Frame | Nreads | Zeropoints | Mag plots | Spatial mag deviation | Spatial sky 16325A emission deviations (filled: sky, open: star) | Spatial sky continuum emission | Spatial sky telluric CO2 absorption deviations (filled: H < 10) | |||||||||||||||||||||||
| 0 | 0 |
|
|
|
|
|
|
| IPAIR | NAME | SHIFT | NEWSHIFT | S/N | NAME | SHIFT | NEWSHIFT | S/N |
| 0 | 11470050 | 0.481124 | 0.00000 | 107.921 | 11470051 | 0.000692062 | 0.480432 | 102.223 |
| 1 | 11470045 | 0.477875 | 0.00324902 | 127.515 | 11470044 | 0.00000 | 0.481124 | 124.355 |
| 2 | 11470046 | 0.478355 | 0.00276902 | 121.140 | 11470047 | -0.00179752 | 0.482922 | 114.629 |
| 3 | 11470049 | 0.480670 | 0.000454009 | 113.723 | 11470048 | -0.00189649 | 0.483021 | 112.746 |