| Red | Green | Blue | |
| z | 17.64 | ||
| znorm | Inf | ||
| sky | -Inf | -Inf | -Inf |
| S/N | 28.0 | 47.2 | 49.6 |
| S/N(c) | 0.0 | 0.0 | 0.0 |
| SN(E/C) |
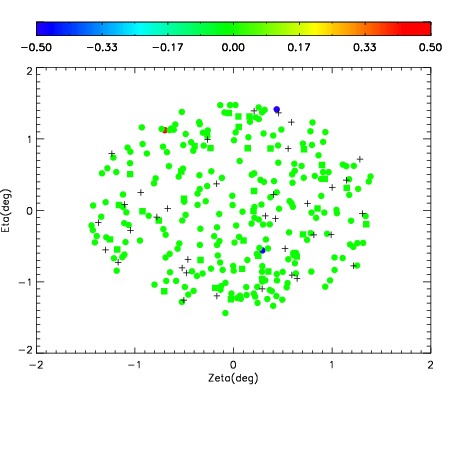
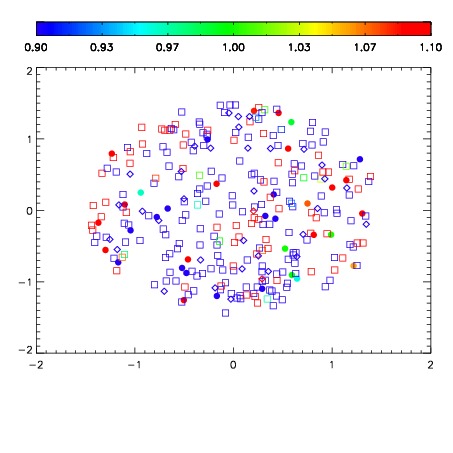
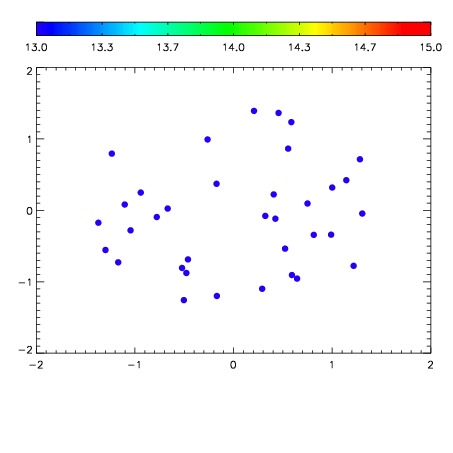

| Frame | Nreads | Zeropoints | Mag plots | Spatial mag deviation | Spatial sky 16325A emission deviations (filled: sky, open: star) | Spatial sky continuum emission | Spatial sky telluric CO2 absorption deviations (filled: H < 10) | |||||||||||||||||||||||
| 0 | 0 |
|
|
|
|
|
|
| IPAIR | NAME | SHIFT | NEWSHIFT | S/N | NAME | SHIFT | NEWSHIFT | S/N |
| 0 | 11550012 | 0.472540 | 0.00000 | 98.8088 | 11550011 | 0.00000 | 0.472540 | 110.799 |
| 1 | 11550020 | 0.471000 | 0.00154001 | 147.889 | 11550019 | -0.00404635 | 0.476586 | 147.615 |
| 2 | 11550017 | 0.470476 | 0.00206399 | 140.217 | 11550018 | -0.00393688 | 0.476477 | 146.489 |
| 3 | 11550016 | 0.471423 | 0.00111699 | 133.259 | 11550014 | -0.00369028 | 0.476230 | 128.947 |
| 4 | 11550013 | 0.472082 | 0.000458002 | 117.569 | 11550015 | -0.00221008 | 0.474750 | 112.791 |