| Red | Green | Blue | |
| z | 17.64 | ||
| znorm | Inf | ||
| sky | -Inf | -NaN | -Inf |
| S/N | 25.9 | 45.5 | 50.8 |
| S/N(c) | 0.0 | 0.0 | 0.0 |
| SN(E/C) |
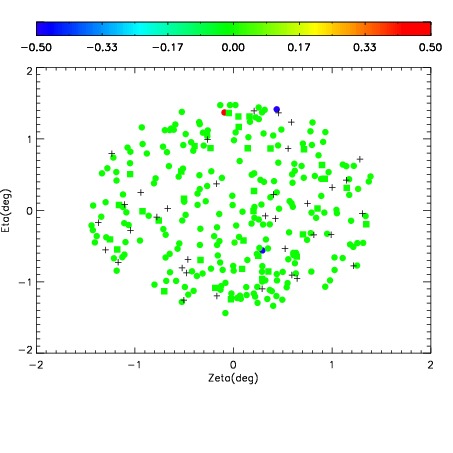
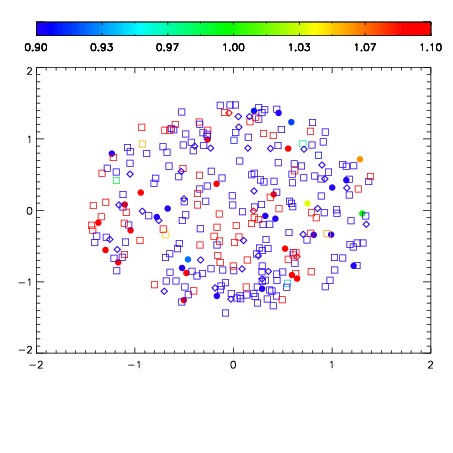
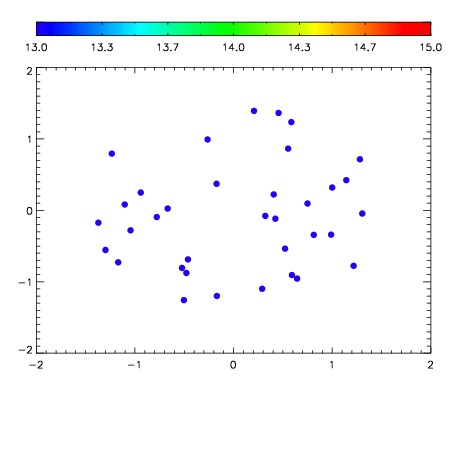

| Frame | Nreads | Zeropoints | Mag plots | Spatial mag deviation | Spatial sky 16325A emission deviations (filled: sky, open: star) | Spatial sky continuum emission | Spatial sky telluric CO2 absorption deviations (filled: H < 10) | |||||||||||||||||||||||
| 0 | 0 |
|
|
|
|
|
|
| IPAIR | NAME | SHIFT | NEWSHIFT | S/N | NAME | SHIFT | NEWSHIFT | S/N |
| 0 | 11730083 | 0.496127 | 0.00000 | 153.702 | 11730077 | 0.00000 | 0.496127 | 143.917 |
| 1 | 11730082 | 0.495865 | 0.000262022 | 155.689 | 11730084 | -0.00428093 | 0.500408 | 159.080 |
| 2 | 11730078 | 0.489958 | 0.00616902 | 139.676 | 11730080 | -0.00351431 | 0.499641 | 143.174 |
| 3 | 11730079 | 0.490408 | 0.00571901 | 133.712 | 11730081 | -0.00329647 | 0.499423 | 141.902 |