| Red | Green | Blue | |
| z | 17.64 | ||
| znorm | Inf | ||
| sky | -Inf | -Inf | -Inf |
| S/N | 28.7 | 45.9 | 53.3 |
| S/N(c) | 0.0 | 0.0 | 0.0 |
| SN(E/C) |
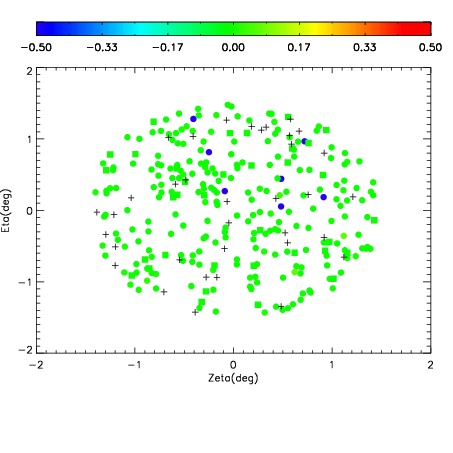
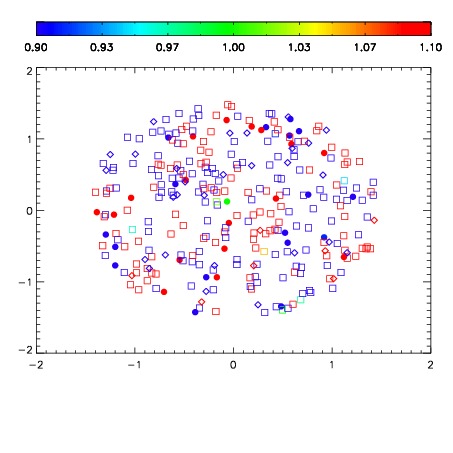
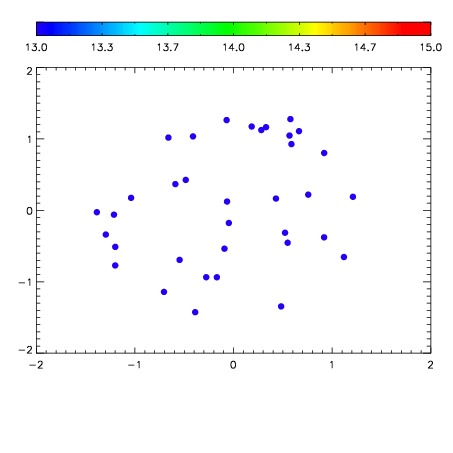

| Frame | Nreads | Zeropoints | Mag plots | Spatial mag deviation | Spatial sky 16325A emission deviations (filled: sky, open: star) | Spatial sky continuum emission | Spatial sky telluric CO2 absorption deviations (filled: H < 10) | |||||||||||||||||||||||
| 0 | 0 |
|
|
|
|
|
|
| IPAIR | NAME | SHIFT | NEWSHIFT | S/N | NAME | SHIFT | NEWSHIFT | S/N |
| 0 | 05230027 | 0.495054 | 0.00000 | 225.251 | 05230028 | 0.000972331 | 0.494082 | 232.984 |
| 1 | 05230023 | 0.493534 | 0.00152001 | 220.212 | 05230024 | 0.000873307 | 0.494181 | 229.074 |
| 2 | 05230022 | 0.493564 | 0.00149000 | 218.572 | 05230025 | 0.00202544 | 0.493029 | 222.881 |
| 3 | 05230026 | 0.494756 | 0.000297993 | 218.536 | 05230021 | 0.00000 | 0.495054 | 215.998 |