| Red | Green | Blue | |
| z | 17.64 | ||
| znorm | Inf | ||
| sky | -Inf | -Inf | -Inf |
| S/N | 20.7 | 38.0 | 42.0 |
| S/N(c) | 0.0 | 0.0 | 0.0 |
| SN(E/C) |
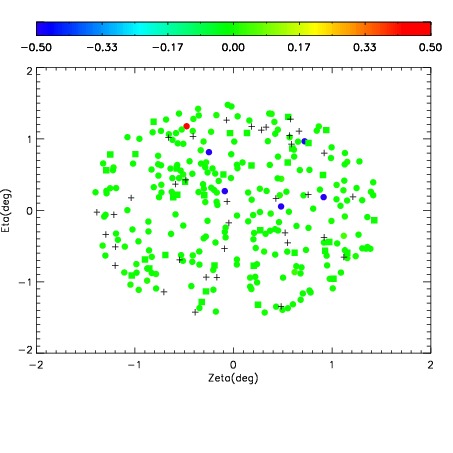
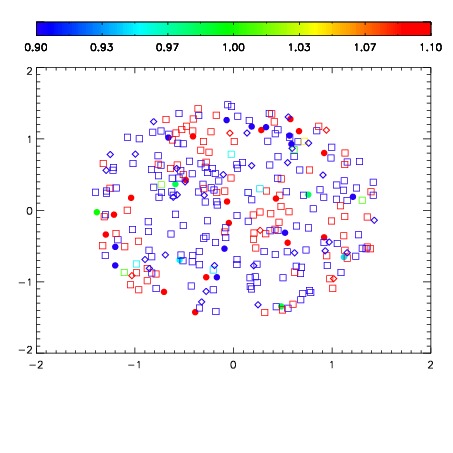
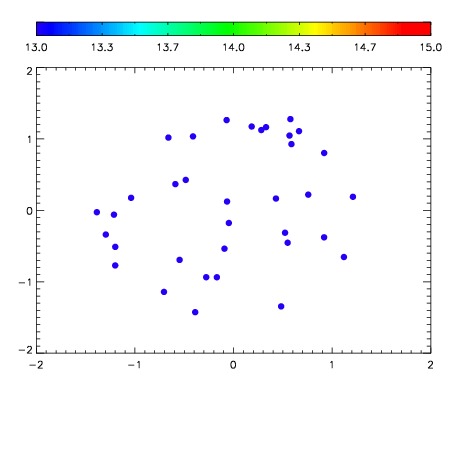

| Frame | Nreads | Zeropoints | Mag plots | Spatial mag deviation | Spatial sky 16325A emission deviations (filled: sky, open: star) | Spatial sky continuum emission | Spatial sky telluric CO2 absorption deviations (filled: H < 10) | |||||||||||||||||||||||
| 0 | 0 |
|
|
|
|
|
|
| IPAIR | NAME | SHIFT | NEWSHIFT | S/N | NAME | SHIFT | NEWSHIFT | S/N |
| 0 | 08760039 | 0.481032 | 0.00000 | 145.533 | 08760040 | 0.00584683 | 0.475185 | 136.916 |
| 1 | 08760038 | 0.480740 | 0.000292003 | 164.225 | 08760037 | 0.00000 | 0.481032 | 155.279 |
| 2 | 08760043 | 0.478166 | 0.00286600 | 149.693 | 08760044 | 0.00388081 | 0.477151 | 151.676 |
| 3 | 08760042 | 0.478242 | 0.00279000 | 145.938 | 08760041 | 0.00456842 | 0.476464 | 146.124 |