| Red | Green | Blue | |
| z | 17.64 | ||
| znorm | Inf | ||
| sky | -Inf | -Inf | -Inf |
| S/N | 28.4 | 48.6 | 55.1 |
| S/N(c) | 0.0 | 0.0 | 0.0 |
| SN(E/C) |
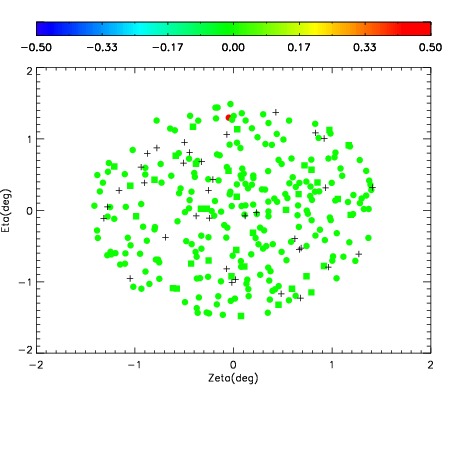
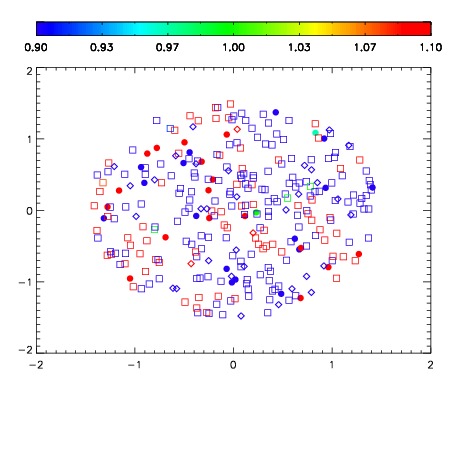
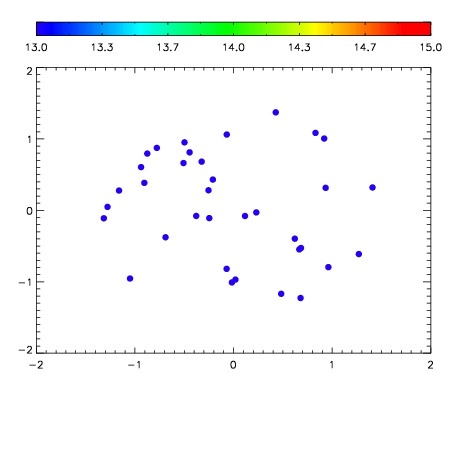

| Frame | Nreads | Zeropoints | Mag plots | Spatial mag deviation | Spatial sky 16325A emission deviations (filled: sky, open: star) | Spatial sky continuum emission | Spatial sky telluric CO2 absorption deviations (filled: H < 10) | |||||||||||||||||||||||
| 0 | 0 |
|
|
|
|
|
|
| IPAIR | NAME | SHIFT | NEWSHIFT | S/N | NAME | SHIFT | NEWSHIFT | S/N |
| 0 | 05230038 | 0.492729 | 0.00000 | 146.046 | 05230039 | 0.00243891 | 0.490290 | 146.770 |
| 1 | 05230037 | 0.492488 | 0.000241011 | 148.281 | 05230036 | 0.00000 | 0.492729 | 155.457 |
| 2 | 05230042 | 0.492606 | 0.000122994 | 145.420 | 05230043 | 0.00414946 | 0.488580 | 145.948 |
| 3 | 05230041 | 0.491406 | 0.00132301 | 144.026 | 05230040 | -7.74371e-05 | 0.492806 | 144.399 |