| Frame | Nreads | Zeropoints | Mag plots
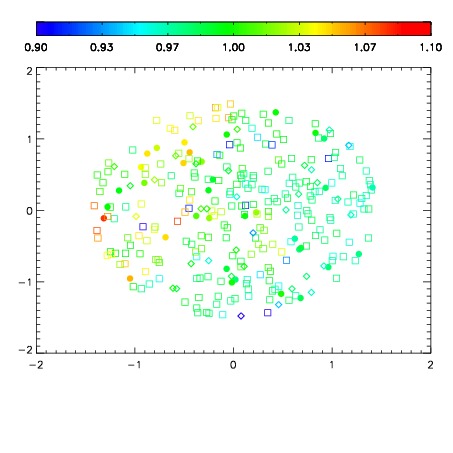
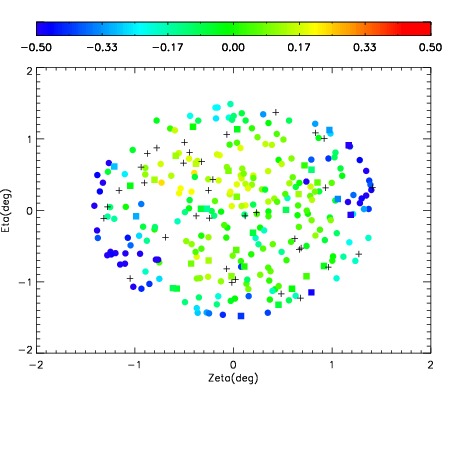
| Spatial mag deviation
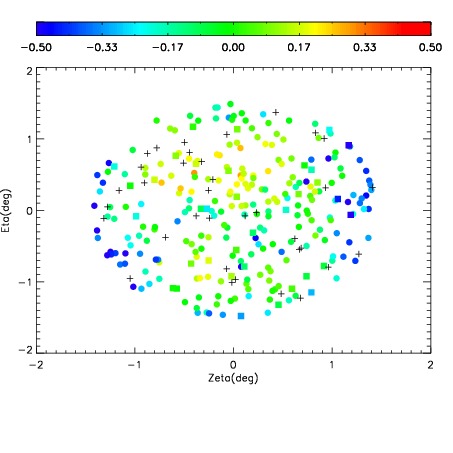
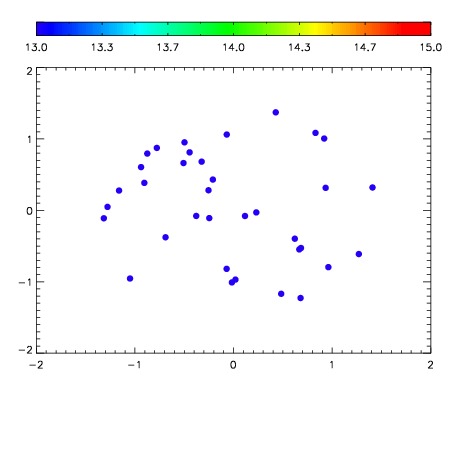
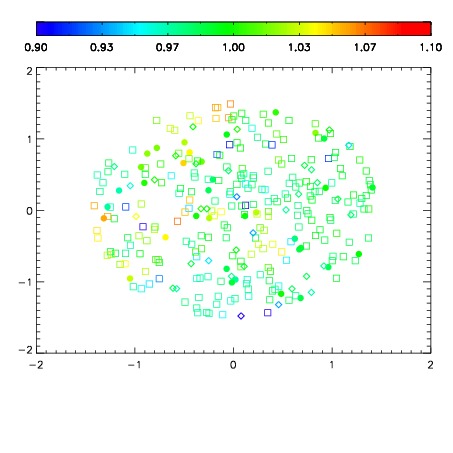
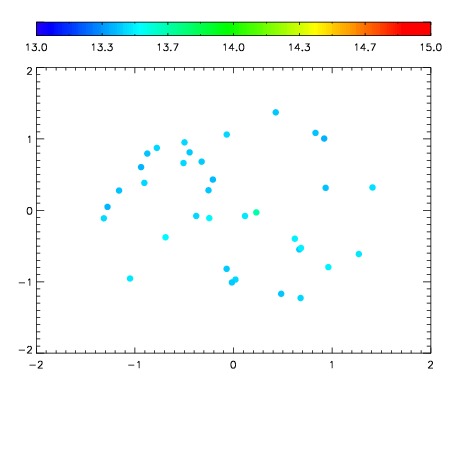
| Spatial sky 16325A emission deviations (filled: sky, open: star)
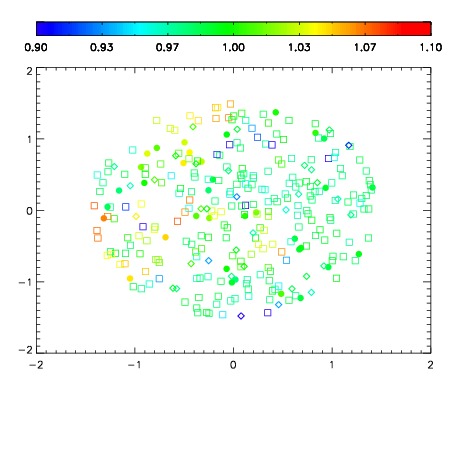
| Spatial sky continuum emission
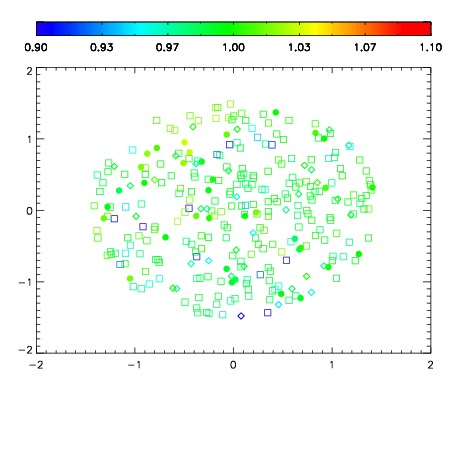
| Spatial sky telluric CO2 absorption deviations (filled: H < 10)
|
| 11960034
| 47
| | Red | Green | Blue
| | z | | 17.05
| | znorm | | 12.87
| | sky | 12.7 | 12.8 | 13.1
| | S/N | 2.5 | 4.7 | 6.2
| | S/N(c) | 2.3 | 4.6 | 5.8
| | SN(E/C) 0.73
|
| 
| 
| 
| 
| 
|
| 11960035
| 47
| | Red | Green | Blue
| | z | | 17.34
| | znorm | | 13.16
| | sky | 12.7 | 12.9 | 13.2
| | S/N | 3.3 | 6.1 | 8.0
| | S/N(c) | 3.1 | 5.5 | 7.3
| | SN(E/C) 0.70
|
| 
| 
| 
| 
| 
|
| 11960036
| 47
| | Red | Green | Blue
| | z | | 17.62
| | znorm | | 13.44
| | sky | 12.9 | 13.0 | 13.4
| | S/N | 4.4 | 8.1 | 10.1
| | S/N(c) | 3.9 | 7.6 | 9.2
| | SN(E/C) 0.63
|
| 
| 
| 
| 
| 
|
| 11960037
| 47
| | Red | Green | Blue
| | z | | 17.81
| | znorm | | 13.63
| | sky | 13.3 | 13.4 | 13.7
| | S/N | 5.3 | 10.0 | 11.5
| | S/N(c) | 4.6 | 9.1 | 10.6
| | SN(E/C) 0.61
|
| 
| 
| 
| 
| 
|