| Red | Green | Blue | |
| z | 17.64 | ||
| znorm | Inf | ||
| sky | -Inf | -NaN | -Inf |
| S/N | 16.1 | 31.0 | 34.5 |
| S/N(c) | 0.0 | 0.0 | 0.0 |
| SN(E/C) |
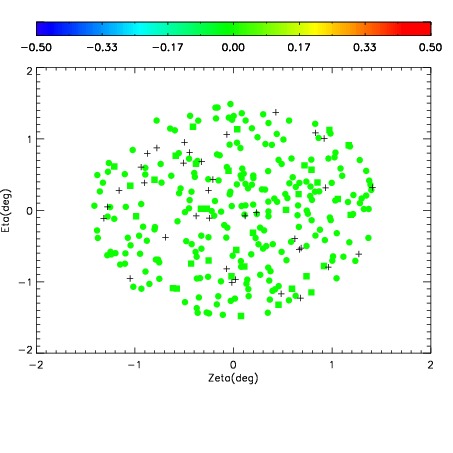
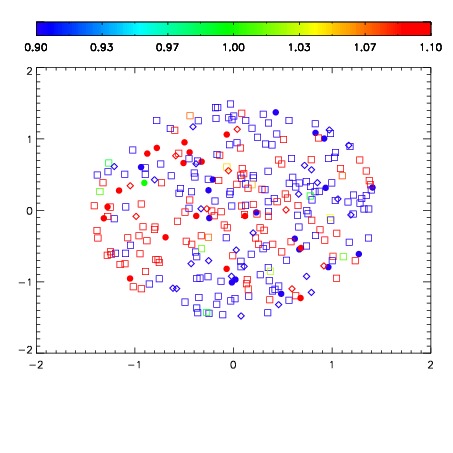
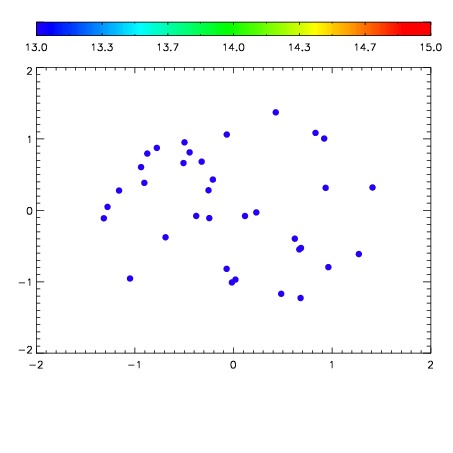

| Frame | Nreads | Zeropoints | Mag plots | Spatial mag deviation | Spatial sky 16325A emission deviations (filled: sky, open: star) | Spatial sky continuum emission | Spatial sky telluric CO2 absorption deviations (filled: H < 10) | |||||||||||||||||||||||
| 0 | 0 |
|
|
|
|
|
|
| IPAIR | NAME | SHIFT | NEWSHIFT | S/N | NAME | SHIFT | NEWSHIFT | S/N |
| 0 | 12030064 | 0.496725 | 0.00000 | 103.839 | 12030063 | -0.00541815 | 0.502143 | 107.591 |
| 1 | 12030060 | 0.495780 | 0.000945002 | 128.470 | 12030059 | 0.00000 | 0.496725 | 137.201 |
| 2 | 12030061 | 0.495155 | 0.00156999 | 120.896 | 12030062 | -0.00509570 | 0.501821 | 124.899 |
| 3 | 12030065 | 0.496521 | 0.000203997 | 101.422 | 12030066 | -0.00590862 | 0.502634 | 106.639 |