| Red | Green | Blue | |
| z | 17.64 | ||
| znorm | Inf | ||
| sky | -Inf | -Inf | -Inf |
| S/N | 16.9 | 32.6 | 36.0 |
| S/N(c) | 0.0 | 0.0 | 0.0 |
| SN(E/C) |
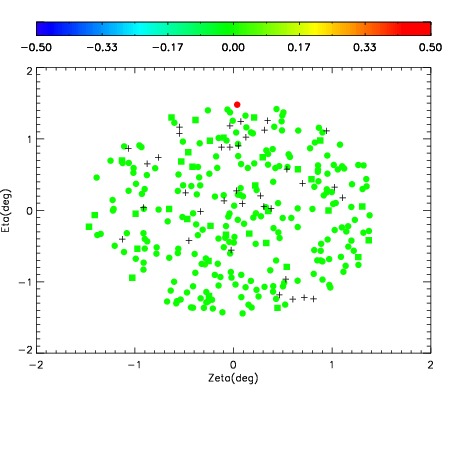
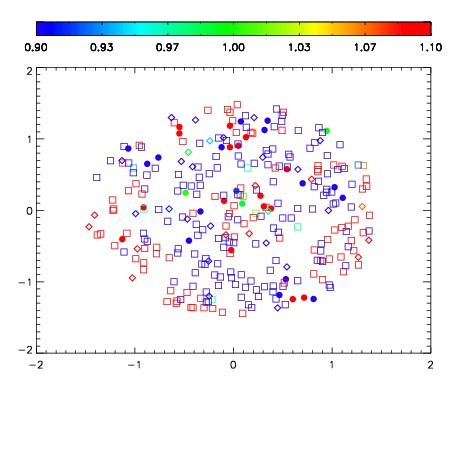
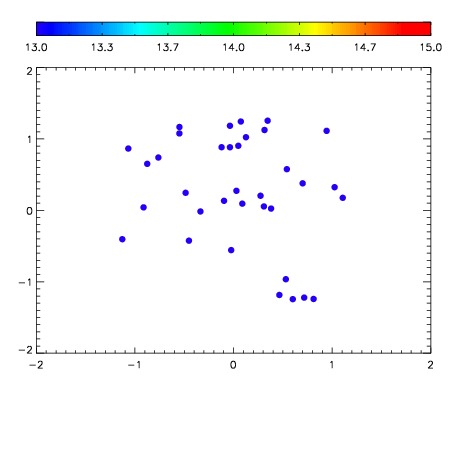

| Frame | Nreads | Zeropoints | Mag plots | Spatial mag deviation | Spatial sky 16325A emission deviations (filled: sky, open: star) | Spatial sky continuum emission | Spatial sky telluric CO2 absorption deviations (filled: H < 10) | |||||||||||||||||||||||
| 0 | 0 |
|
|
|
|
|
|
| IPAIR | NAME | SHIFT | NEWSHIFT | S/N | NAME | SHIFT | NEWSHIFT | S/N |
| 0 | 11720079 | 0.488442 | 0.00000 | 152.855 | 11720084 | -0.00653155 | 0.494974 | 121.945 |
| 1 | 11720078 | 0.487553 | 0.000889003 | 180.837 | 11720077 | 0.00000 | 0.488442 | 174.822 |
| 2 | 11720082 | 0.486308 | 0.00213400 | 160.040 | 11720081 | -0.00352483 | 0.491967 | 161.592 |
| 3 | 11720083 | 0.487009 | 0.00143301 | 156.067 | 11720080 | -0.00327042 | 0.491712 | 149.495 |