| Red | Green | Blue | |
| z | 17.64 | ||
| znorm | Inf | ||
| sky | -Inf | -Inf | -Inf |
| S/N | 29.0 | 47.8 | 56.3 |
| S/N(c) | 0.0 | 0.0 | 0.0 |
| SN(E/C) |
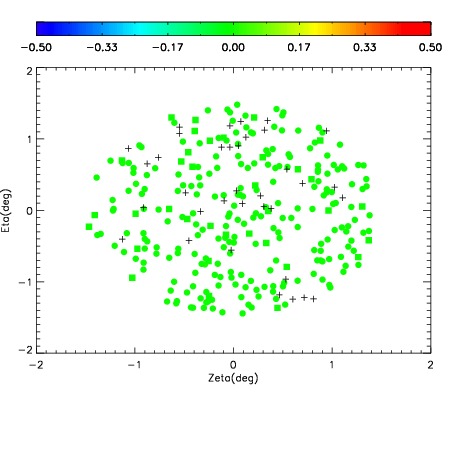
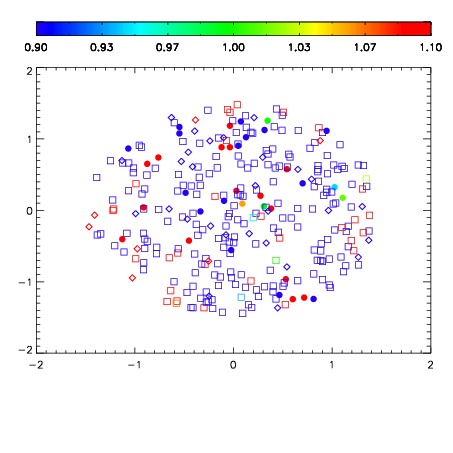
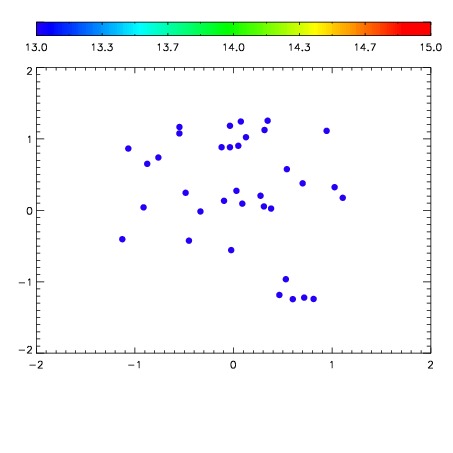

| Frame | Nreads | Zeropoints | Mag plots | Spatial mag deviation | Spatial sky 16325A emission deviations (filled: sky, open: star) | Spatial sky continuum emission | Spatial sky telluric CO2 absorption deviations (filled: H < 10) | |||||||||||||||||||||||
| 0 | 0 |
|
|
|
|
|
|
| IPAIR | NAME | SHIFT | NEWSHIFT | S/N | NAME | SHIFT | NEWSHIFT | S/N |
| 0 | 12000067 | 0.499505 | 0.00000 | 196.955 | 12000066 | 0.00000 | 0.499505 | 207.845 |
| 1 | 12000072 | 0.496686 | 0.00281900 | 200.365 | 12000073 | -0.00361158 | 0.503117 | 210.100 |
| 2 | 12000071 | 0.496330 | 0.00317502 | 195.346 | 12000069 | -0.000214925 | 0.499720 | 193.430 |
| 3 | 12000068 | 0.499418 | 8.70228e-05 | 182.698 | 12000070 | -0.000942830 | 0.500448 | 189.223 |