| Red | Green | Blue | |
| z | 17.64 | ||
| znorm | Inf | ||
| sky | -Inf | -Inf | -Inf |
| S/N | 27.3 | 46.6 | 48.9 |
| S/N(c) | 0.0 | 0.0 | 0.0 |
| SN(E/C) |
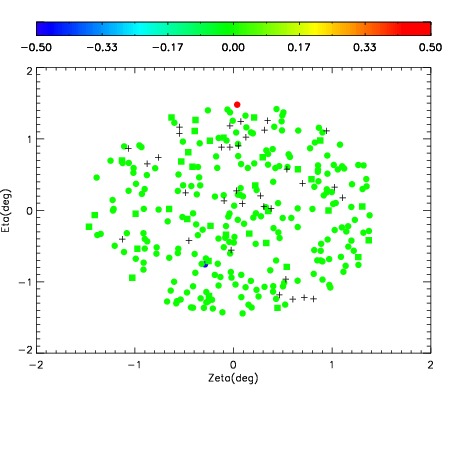


| Frame | Nreads | Zeropoints | Mag plots | Spatial mag deviation | Spatial sky 16325A emission deviations (filled: sky, open: star) | Spatial sky continuum emission | Spatial sky telluric CO2 absorption deviations (filled: H < 10) | |||||||||||||||||||||||
| 0 | 0 |
|
|
|
|
|
|
| IPAIR | NAME | SHIFT | NEWSHIFT | S/N | NAME | SHIFT | NEWSHIFT | S/N |
| 0 | 12060072 | 0.499657 | 0.00000 | 184.089 | 12060073 | -0.00519677 | 0.504854 | 179.974 |
| 1 | 12060075 | 0.498380 | 0.00127700 | 190.139 | 12060077 | -0.00558844 | 0.505245 | 191.845 |
| 2 | 12060071 | 0.499516 | 0.000140995 | 185.706 | 12060074 | -0.00514226 | 0.504799 | 191.095 |
| 3 | 12060076 | 0.498916 | 0.000741005 | 184.987 | 12060070 | 0.00000 | 0.499657 | 181.528 |