| Red | Green | Blue | |
| z | 17.64 | ||
| znorm | Inf | ||
| sky | -Inf | -Inf | -Inf |
| S/N | 21.7 | 37.6 | 42.3 |
| S/N(c) | 0.0 | 0.0 | 0.0 |
| SN(E/C) |
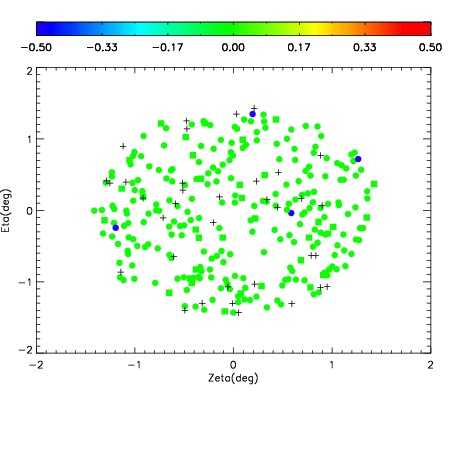
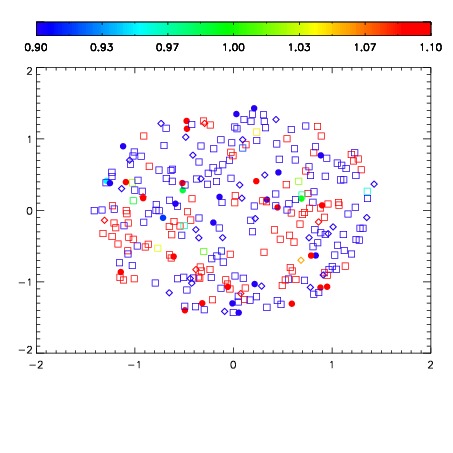
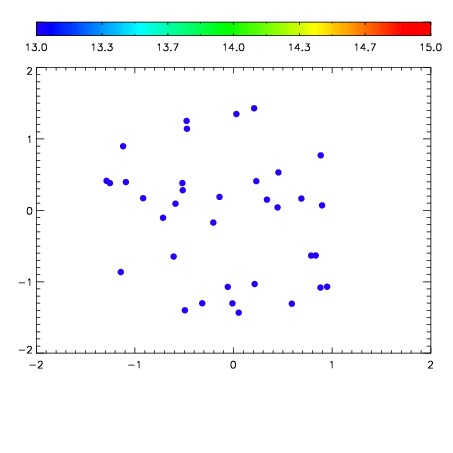

| Frame | Nreads | Zeropoints | Mag plots | Spatial mag deviation | Spatial sky 16325A emission deviations (filled: sky, open: star) | Spatial sky continuum emission | Spatial sky telluric CO2 absorption deviations (filled: H < 10) | |||||||||||||||||||||||
| 0 | 0 |
|
|
|
|
|
|
| IPAIR | NAME | SHIFT | NEWSHIFT | S/N | NAME | SHIFT | NEWSHIFT | S/N |
| 0 | 11730094 | 0.496484 | 0.00000 | 190.711 | 11730088 | 0.00000 | 0.496484 | 196.259 |
| 1 | 11730093 | 0.495717 | 0.000767022 | 191.498 | 11730091 | -0.00216709 | 0.498651 | 197.881 |
| 2 | 11730090 | 0.495558 | 0.000926018 | 184.388 | 11730095 | -0.00261723 | 0.499101 | 195.583 |
| 3 | 11730089 | 0.494881 | 0.00160301 | 183.421 | 11730092 | -0.00135368 | 0.497838 | 194.948 |