| Red | Green | Blue | |
| z | 17.64 | ||
| znorm | Inf | ||
| sky | -Inf | -NaN | -Inf |
| S/N | 20.3 | 37.1 | 38.5 |
| S/N(c) | 0.0 | 0.0 | 0.0 |
| SN(E/C) |

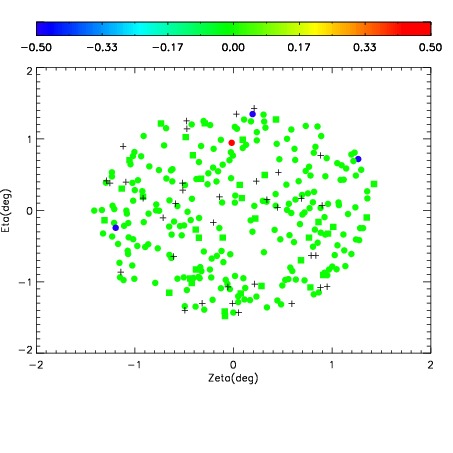
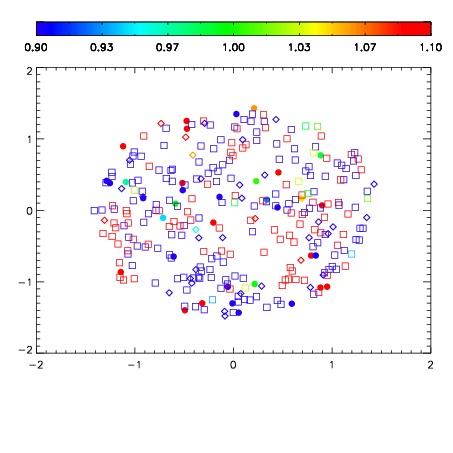
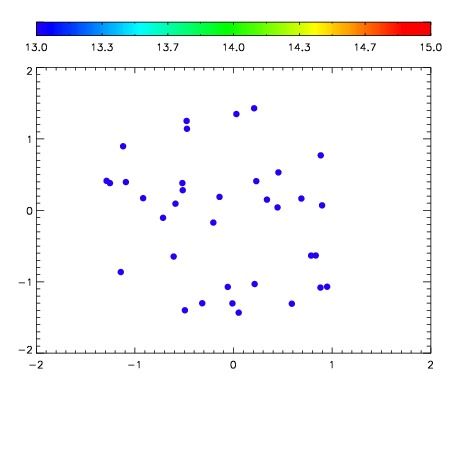

| Frame | Nreads | Zeropoints | Mag plots | Spatial mag deviation | Spatial sky 16325A emission deviations (filled: sky, open: star) | Spatial sky continuum emission | Spatial sky telluric CO2 absorption deviations (filled: H < 10) | |||||||||||||||||||||||
| 0 | 0 |
|
|
|
|
|
|
| IPAIR | NAME | SHIFT | NEWSHIFT | S/N | NAME | SHIFT | NEWSHIFT | S/N |
| 0 | 11880012 | 0.499530 | 0.00000 | 196.910 | 11880015 | -0.00491617 | 0.504446 | 198.011 |
| 1 | 11880013 | 0.497809 | 0.00172099 | 197.254 | 11880011 | 0.00000 | 0.499530 | 198.651 |
| 2 | 11880016 | 0.496142 | 0.00338799 | 193.663 | 11880014 | -0.00499679 | 0.504527 | 194.382 |
| 3 | 11880017 | 0.496476 | 0.00305399 | 191.723 | 11880018 | -0.00427301 | 0.503803 | 178.696 |