| Red | Green | Blue | |
| z | 17.64 | ||
| znorm | Inf | ||
| sky | -Inf | -Inf | -Inf |
| S/N | 23.1 | 40.5 | 45.1 |
| S/N(c) | 0.0 | 0.0 | 0.0 |
| SN(E/C) |
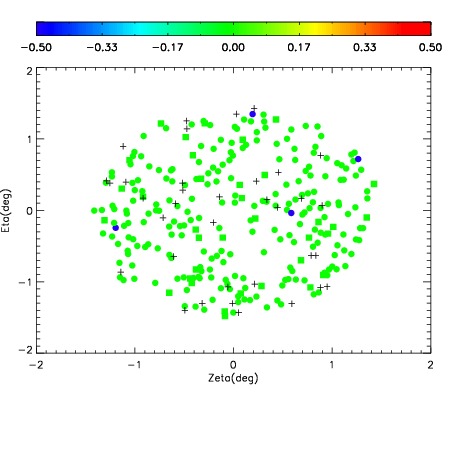

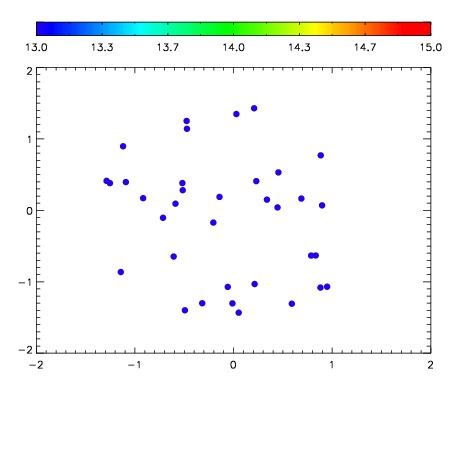

| Frame | Nreads | Zeropoints | Mag plots | Spatial mag deviation | Spatial sky 16325A emission deviations (filled: sky, open: star) | Spatial sky continuum emission | Spatial sky telluric CO2 absorption deviations (filled: H < 10) | |||||||||||||||||||||||
| 0 | 0 |
|
|
|
|
|
|
| IPAIR | NAME | SHIFT | NEWSHIFT | S/N | NAME | SHIFT | NEWSHIFT | S/N |
| 0 | 12060083 | 0.500688 | 0.00000 | 223.554 | 12060088 | -0.00387646 | 0.504564 | 232.403 |
| 1 | 12060086 | 0.499420 | 0.00126803 | 222.920 | 12060084 | -0.00459087 | 0.505279 | 227.220 |
| 2 | 12060082 | 0.499700 | 0.000988007 | 218.071 | 12060085 | -0.00438296 | 0.505071 | 223.375 |
| 3 | 12060087 | 0.500236 | 0.000452042 | 215.807 | 12060081 | 0.00000 | 0.500688 | 217.514 |