| Red | Green | Blue | |
| z | 17.64 | ||
| znorm | Inf | ||
| sky | -Inf | -Inf | -Inf |
| S/N | 13.3 | 26.7 | 27.1 |
| S/N(c) | 0.0 | 0.0 | 0.0 |
| SN(E/C) |
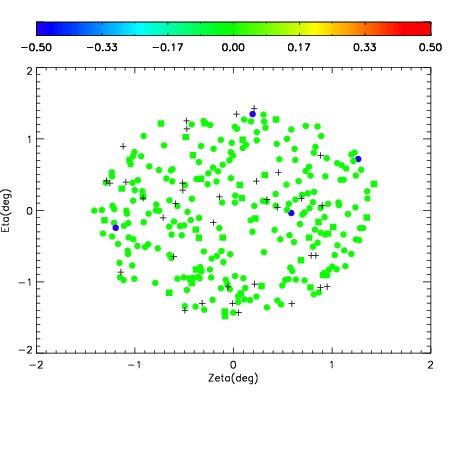
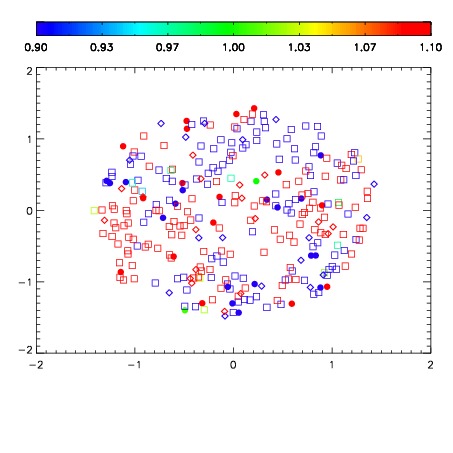
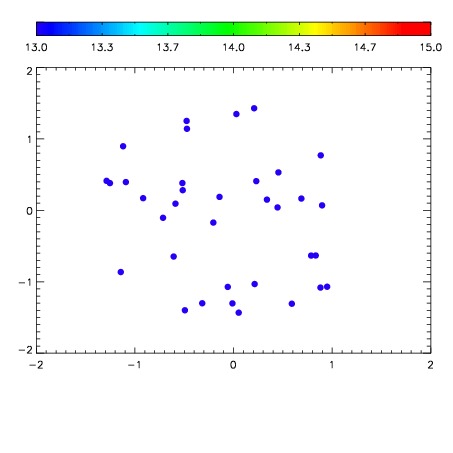

| Frame | Nreads | Zeropoints | Mag plots | Spatial mag deviation | Spatial sky 16325A emission deviations (filled: sky, open: star) | Spatial sky continuum emission | Spatial sky telluric CO2 absorption deviations (filled: H < 10) | |||||||||||||||||||||||
| 0 | 0 |
|
|
|
|
|
|
| IPAIR | NAME | SHIFT | NEWSHIFT | S/N | NAME | SHIFT | NEWSHIFT | S/N |
| 0 | 12110013 | 0.498463 | 0.00000 | 162.872 | 12110015 | -0.00161958 | 0.500083 | 167.049 |
| 1 | 12110012 | 0.497969 | 0.000494003 | 153.999 | 12110011 | 0.00000 | 0.498463 | 157.738 |
| 2 | 12110016 | 0.497968 | 0.000495017 | 141.842 | 12110014 | -0.00175476 | 0.500218 | 149.780 |
| 3 | 12110017 | 0.497456 | 0.00100699 | 138.111 | 12110018 | -0.00310989 | 0.501573 | 140.319 |