| Red | Green | Blue | |
| z | 17.64 | ||
| znorm | Inf | ||
| sky | -Inf | -Inf | -Inf |
| S/N | 24.2 | 41.7 | 47.1 |
| S/N(c) | 0.0 | 0.0 | 0.0 |
| SN(E/C) |

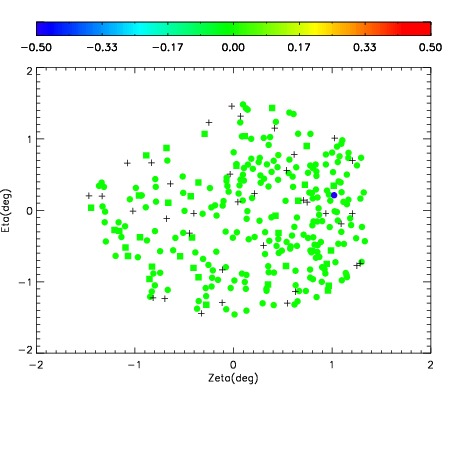
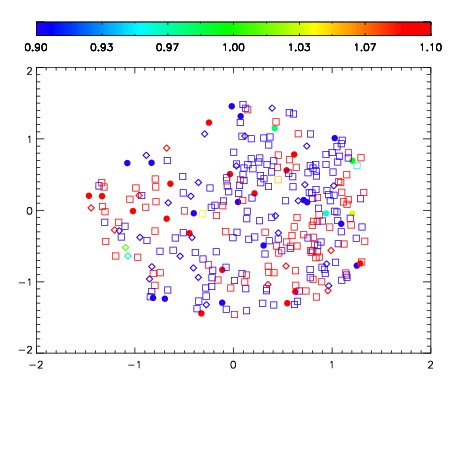


| Frame | Nreads | Zeropoints | Mag plots | Spatial mag deviation | Spatial sky 16325A emission deviations (filled: sky, open: star) | Spatial sky continuum emission | Spatial sky telluric CO2 absorption deviations (filled: H < 10) | |||||||||||||||||||||||
| 0 | 0 |
|
|
|
|
|
|
| IPAIR | NAME | SHIFT | NEWSHIFT | S/N | NAME | SHIFT | NEWSHIFT | S/N |
| 0 | 11930019 | 0.500535 | 0.00000 | 172.917 | 11930021 | -0.00580497 | 0.506340 | 171.782 |
| 1 | 11930020 | 0.500225 | 0.000310004 | 174.537 | 11930022 | -0.00525379 | 0.505789 | 172.026 |
| 2 | 11930024 | 0.500379 | 0.000155985 | 168.701 | 11930018 | 0.00000 | 0.500535 | 167.594 |
| 3 | 11930023 | 0.500140 | 0.000395000 | 158.577 | 11930025 | -0.00438323 | 0.504918 | 165.470 |