| Red | Green | Blue | |
| z | 17.64 | ||
| znorm | Inf | ||
| sky | -Inf | -Inf | -Inf |
| S/N | 22.2 | 39.5 | 43.2 |
| S/N(c) | 0.0 | 0.0 | 0.0 |
| SN(E/C) |
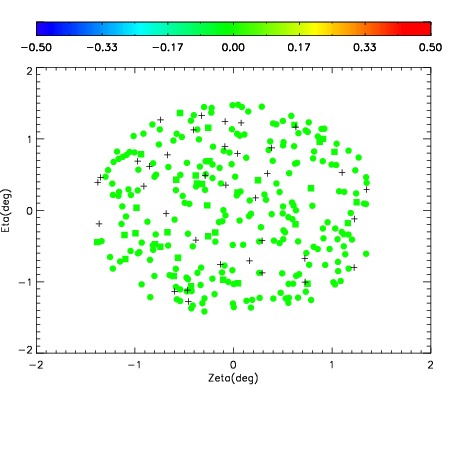
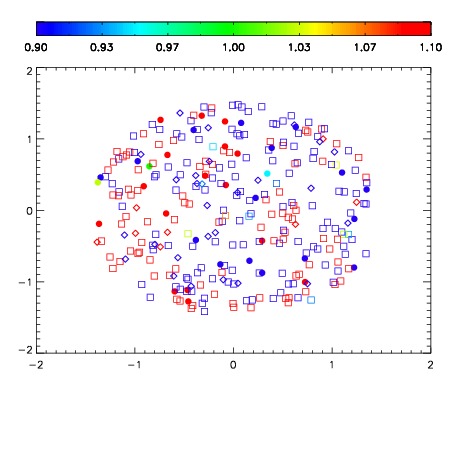
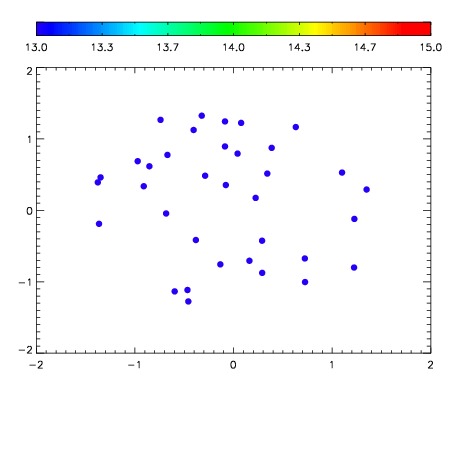

| Frame | Nreads | Zeropoints | Mag plots | Spatial mag deviation | Spatial sky 16325A emission deviations (filled: sky, open: star) | Spatial sky continuum emission | Spatial sky telluric CO2 absorption deviations (filled: H < 10) | |||||||||||||||||||||||
| 0 | 0 |
|
|
|
|
|
|
| IPAIR | NAME | SHIFT | NEWSHIFT | S/N | NAME | SHIFT | NEWSHIFT | S/N |
| 0 | 11540017 | 0.466008 | 0.00000 | 192.350 | 11540011 | 0.00000 | 0.466008 | 182.807 |
| 1 | 11540012 | 0.465078 | 0.000930011 | 200.213 | 11540015 | -0.00525801 | 0.471266 | 201.294 |
| 2 | 11540016 | 0.465597 | 0.000411004 | 197.384 | 11540014 | -0.00499232 | 0.471000 | 196.688 |
| 3 | 11540013 | 0.465868 | 0.000140011 | 196.840 | 11540018 | -0.00824213 | 0.474250 | 190.753 |