| Red | Green | Blue | |
| z | 17.64 | ||
| znorm | Inf | ||
| sky | -Inf | -Inf | -Inf |
| S/N | 24.3 | 44.7 | 46.7 |
| S/N(c) | 0.0 | 0.0 | 0.0 |
| SN(E/C) |

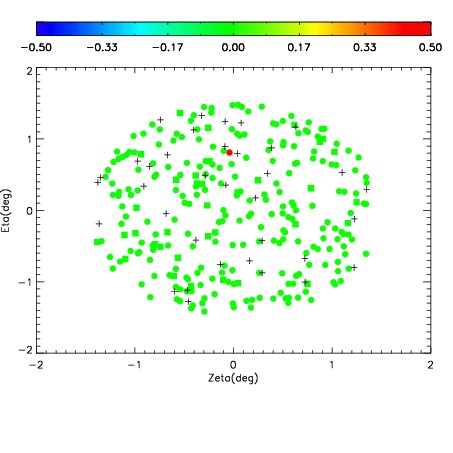
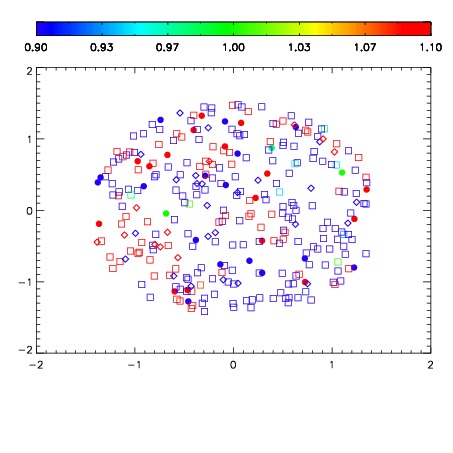
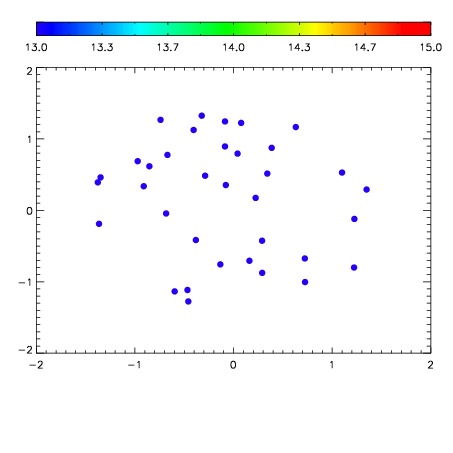

| Frame | Nreads | Zeropoints | Mag plots | Spatial mag deviation | Spatial sky 16325A emission deviations (filled: sky, open: star) | Spatial sky continuum emission | Spatial sky telluric CO2 absorption deviations (filled: H < 10) | |||||||||||||||||||||||
| 0 | 0 |
|
|
|
|
|
|
| IPAIR | NAME | SHIFT | NEWSHIFT | S/N | NAME | SHIFT | NEWSHIFT | S/N |
| 0 | 11610013 | 0.484856 | 0.00000 | 218.492 | 11610014 | -0.00342618 | 0.488282 | 229.988 |
| 1 | 11610017 | 0.483191 | 0.00166500 | 238.544 | 11610018 | -0.00648157 | 0.491338 | 240.299 |
| 2 | 11610016 | 0.483131 | 0.00172502 | 231.858 | 11610015 | -0.00353410 | 0.488390 | 237.650 |
| 3 | 11610012 | 0.484795 | 6.10054e-05 | 210.964 | 11610011 | 0.00000 | 0.484856 | 215.272 |