| Red | Green | Blue | |
| z | 17.64 | ||
| znorm | Inf | ||
| sky | -Inf | -Inf | -Inf |
| S/N | 19.6 | 36.5 | 41.3 |
| S/N(c) | 0.0 | 0.0 | 0.0 |
| SN(E/C) |
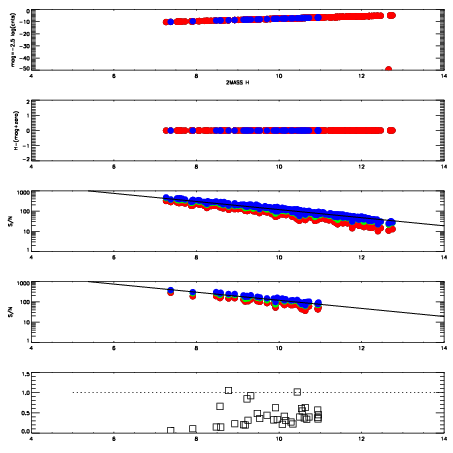
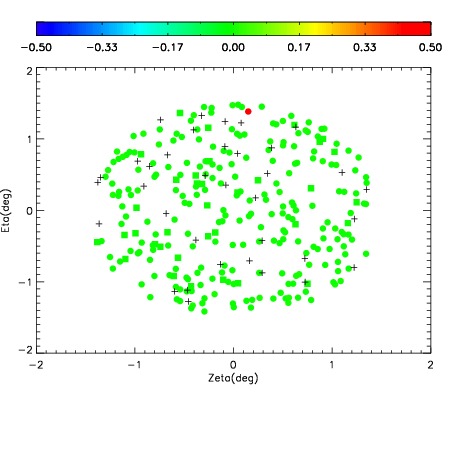
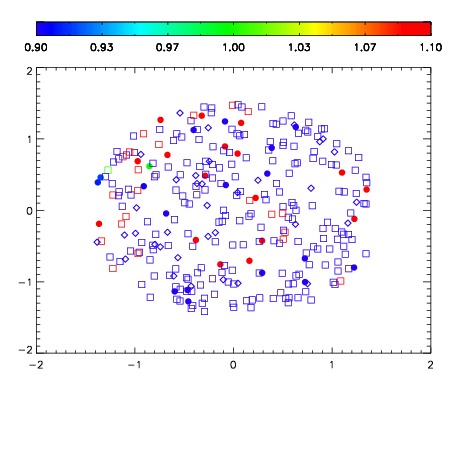
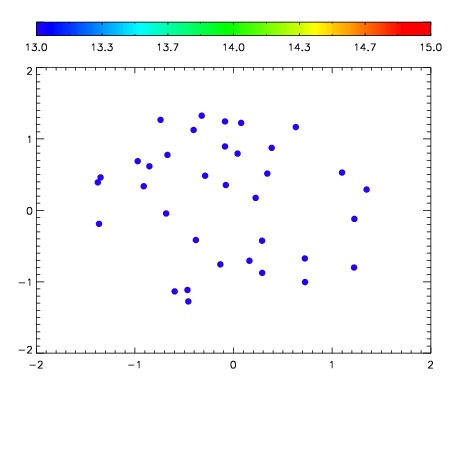

| Frame | Nreads | Zeropoints | Mag plots | Spatial mag deviation | Spatial sky 16325A emission deviations (filled: sky, open: star) | Spatial sky continuum emission | Spatial sky telluric CO2 absorption deviations (filled: H < 10) | |||||||||||||||||||||||
| 0 | 0 |
|
|
|
|
|
|
| IPAIR | NAME | SHIFT | NEWSHIFT | S/N | NAME | SHIFT | NEWSHIFT | S/N |
| 0 | 11670090 | 0.496613 | 0.00000 | 187.123 | 11670084 | 0.00000 | 0.496613 | 175.310 |
| 1 | 11670089 | 0.495642 | 0.000970989 | 223.379 | 11670087 | 0.000436587 | 0.496176 | 203.441 |
| 2 | 11670086 | 0.494018 | 0.00259501 | 199.002 | 11670088 | 0.000779756 | 0.495833 | 194.427 |
| 3 | 11670085 | 0.493017 | 0.00359601 | 181.220 | 11670091 | -0.000108841 | 0.496722 | 171.813 |