| Red | Green | Blue | |
| z | 17.64 | ||
| znorm | Inf | ||
| sky | -NaN | -Inf | -Inf |
| S/N | 18.3 | 28.1 | 29.8 |
| S/N(c) | 0.0 | 0.0 | 0.0 |
| SN(E/C) |
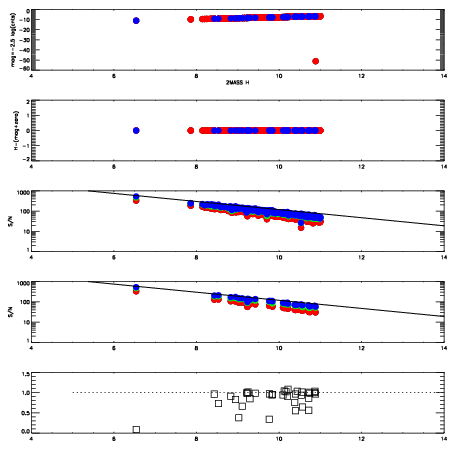
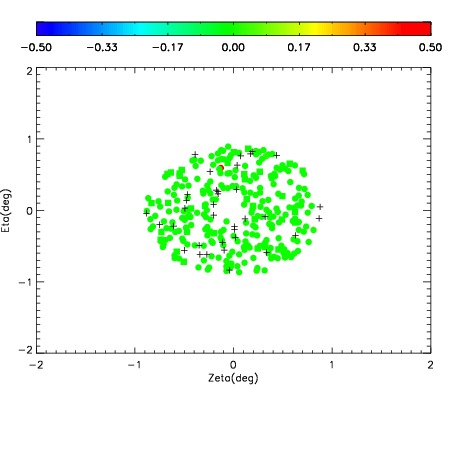
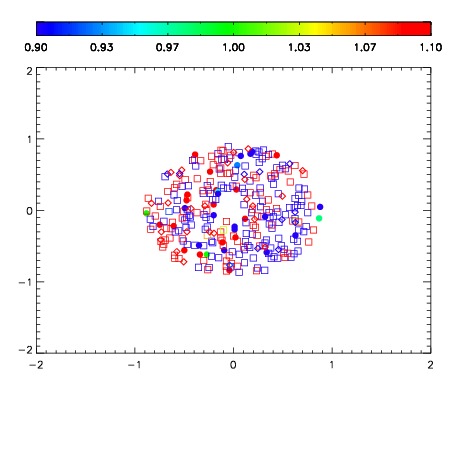
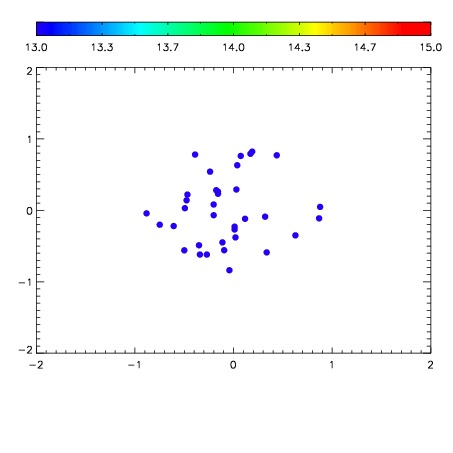

| Frame | Nreads | Zeropoints | Mag plots | Spatial mag deviation | Spatial sky 16325A emission deviations (filled: sky, open: star) | Spatial sky continuum emission | Spatial sky telluric CO2 absorption deviations (filled: H < 10) | |||||||||||||||||||||||
| 0 | 0 |
|
|
|
|
|
|
| IPAIR | NAME | SHIFT | NEWSHIFT | S/N | NAME | SHIFT | NEWSHIFT | S/N |
| 0 | 08710046 | 0.477623 | 0.00000 | 110.614 | 08710047 | 0.00302510 | 0.474598 | 106.268 |
| 1 | 08710050 | 0.474746 | 0.00287700 | 137.581 | 08710044 | 0.00000 | 0.477623 | 146.106 |
| 2 | 08710045 | 0.475125 | 0.00249797 | 117.868 | 08710051 | 0.00690156 | 0.470721 | 137.244 |
| 3 | 08710049 | 0.477119 | 0.000503987 | 102.258 | 08710048 | 0.00277482 | 0.474848 | 103.300 |