| Red | Green | Blue | |
| z | 17.64 | ||
| znorm | Inf | ||
| sky | -NaN | -NaN | -Inf |
| S/N | 26.7 | 39.1 | 42.7 |
| S/N(c) | 0.0 | 0.0 | 0.0 |
| SN(E/C) |
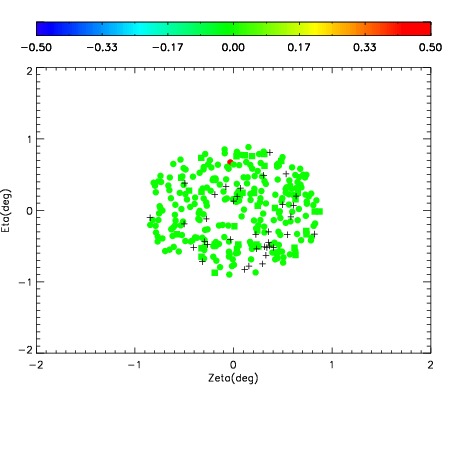
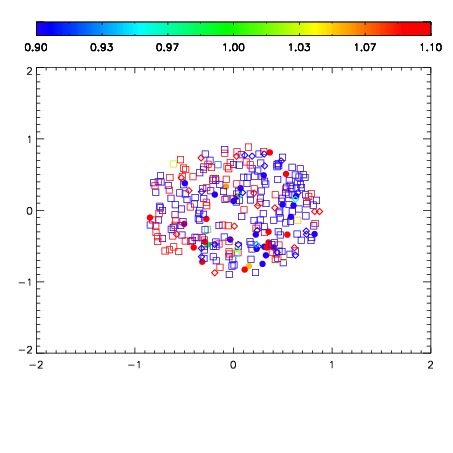
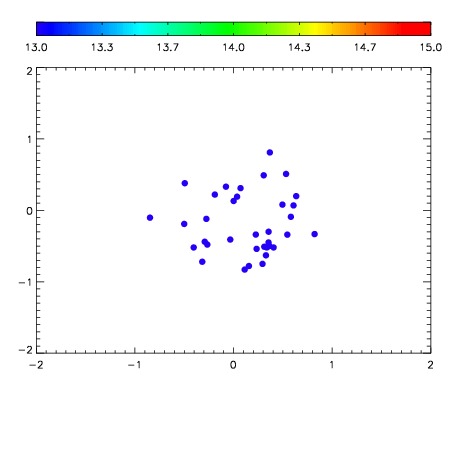

| Frame | Nreads | Zeropoints | Mag plots | Spatial mag deviation | Spatial sky 16325A emission deviations (filled: sky, open: star) | Spatial sky continuum emission | Spatial sky telluric CO2 absorption deviations (filled: H < 10) | |||||||||||||||||||||||
| 0 | 0 |
|
|
|
|
|
|
| IPAIR | NAME | SHIFT | NEWSHIFT | S/N | NAME | SHIFT | NEWSHIFT | S/N |
| 0 | 08530069 | 0.485045 | 0.00000 | 185.718 | 08530067 | 0.00209077 | 0.482954 | 194.669 |
| 1 | 08530065 | 0.482802 | 0.00224298 | 194.153 | 08530066 | 0.00211333 | 0.482932 | 196.608 |
| 2 | 08530068 | 0.484775 | 0.000269979 | 180.639 | 08530070 | 0.00190768 | 0.483137 | 193.949 |
| 3 | 08530064 | 0.482922 | 0.00212300 | 174.381 | 08530063 | 0.00000 | 0.485045 | 157.183 |