| Red | Green | Blue | |
| z | 17.63 | ||
| znorm | Inf | ||
| sky | -NaN | -NaN | -Inf |
| S/N | 16.3 | 30.0 | 30.6 |
| S/N(c) | 0.0 | 0.0 | 0.0 |
| SN(E/C) |

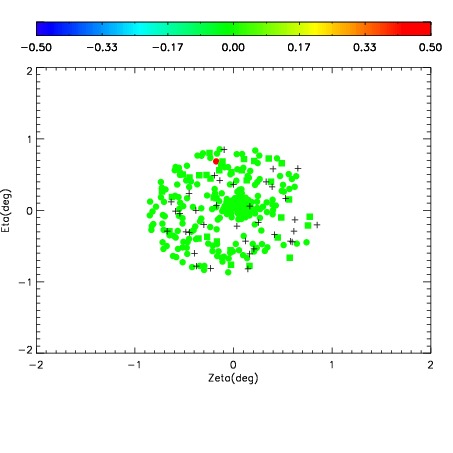
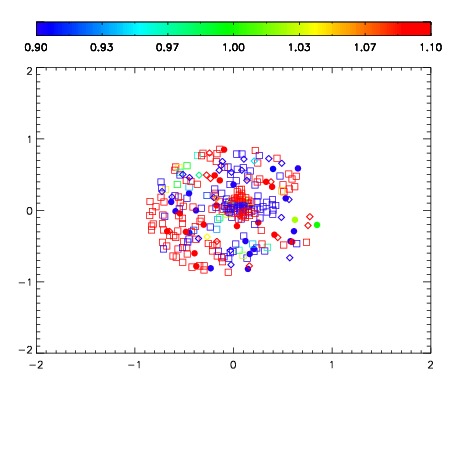
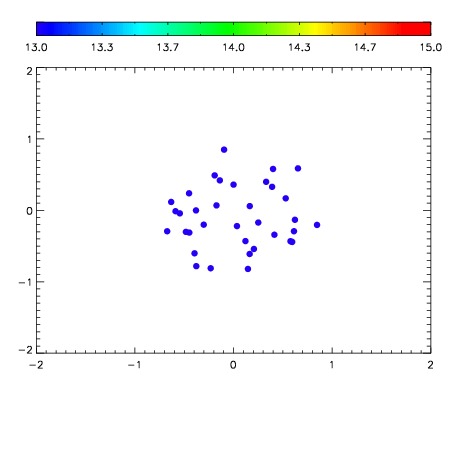

| Frame | Nreads | Zeropoints | Mag plots | Spatial mag deviation | Spatial sky 16325A emission deviations (filled: sky, open: star) | Spatial sky continuum emission | Spatial sky telluric CO2 absorption deviations (filled: H < 10) | |||||||||||||||||||||||
| 0 | 0 |
|
|
|
|
|
|
| IPAIR | NAME | SHIFT | NEWSHIFT | S/N | NAME | SHIFT | NEWSHIFT | S/N |
| 0 | 04590036 | 0.502322 | 0.00000 | 162.717 | 04590037 | 0.00266886 | 0.499653 | 173.970 |
| 1 | 04590035 | 0.502266 | 5.60284e-05 | 132.145 | 04590033 | 0.000786173 | 0.501536 | 137.714 |
| 2 | 04590032 | 0.501352 | 0.000970006 | 126.300 | 04590034 | 0.00237865 | 0.499943 | 136.693 |
| 3 | 04590031 | 0.498967 | 0.00335503 | 120.144 | 04590030 | 0.00000 | 0.502322 | 110.954 |