| Red | Green | Blue | |
| z | 17.64 | ||
| znorm | Inf | ||
| sky | -NaN | -Inf | -Inf |
| S/N | 11.4 | 20.8 | 21.8 |
| S/N(c) | 0.0 | 0.0 | 0.0 |
| SN(E/C) |

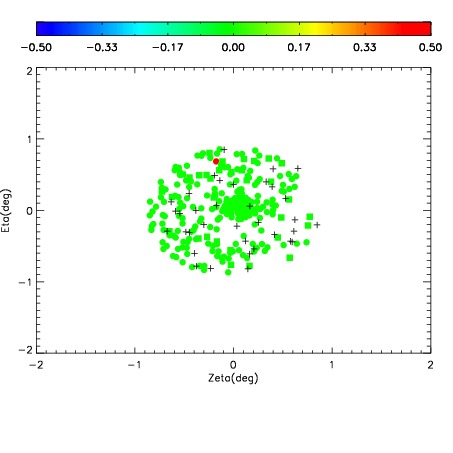
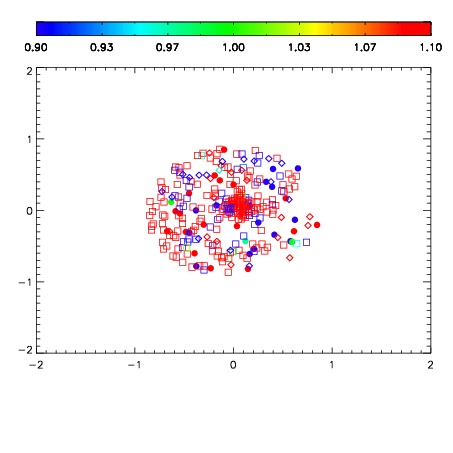
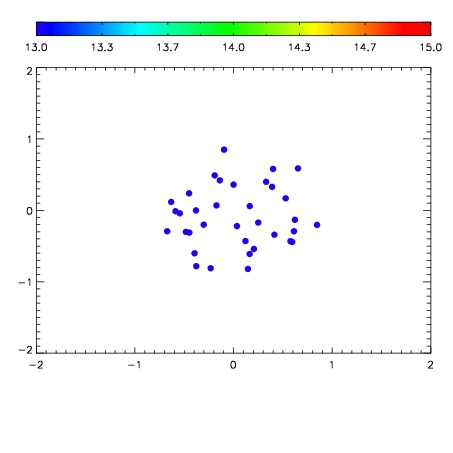

| Frame | Nreads | Zeropoints | Mag plots | Spatial mag deviation | Spatial sky 16325A emission deviations (filled: sky, open: star) | Spatial sky continuum emission | Spatial sky telluric CO2 absorption deviations (filled: H < 10) | |||||||||||||||||||||||
| 0 | 0 |
|
|
|
|
|
|
| IPAIR | NAME | SHIFT | NEWSHIFT | S/N | NAME | SHIFT | NEWSHIFT | S/N |
| 0 | 05470036 | 0.492388 | 0.00000 | 135.735 | 05470038 | -0.000959632 | 0.493348 | 141.840 |
| 1 | 05470039 | 0.488552 | 0.00383601 | 154.055 | 05470037 | -0.00101740 | 0.493405 | 150.438 |
| 2 | 05470035 | 0.491673 | 0.000715017 | 127.948 | 05470034 | 0.00000 | 0.492388 | 129.602 |
| 3 | 05470040 | 0.489982 | 0.00240600 | 86.2353 | 05470041 | -0.00185237 | 0.494240 | 55.2582 |