| Red | Green | Blue | |
| z | 17.64 | ||
| znorm | Inf | ||
| sky | -Inf | -NaN | -Inf |
| S/N | 14.6 | 26.2 | 26.1 |
| S/N(c) | 0.0 | 0.0 | 0.0 |
| SN(E/C) |
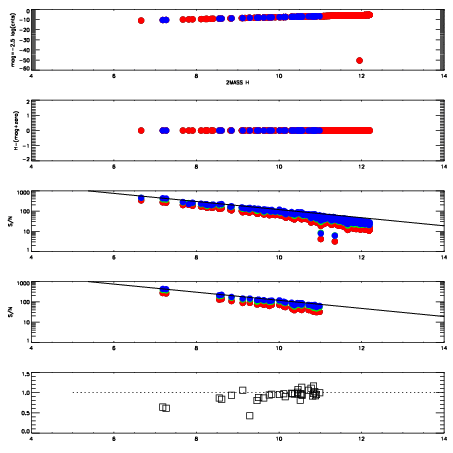
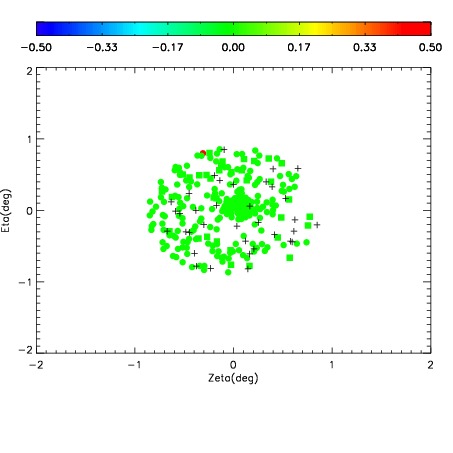
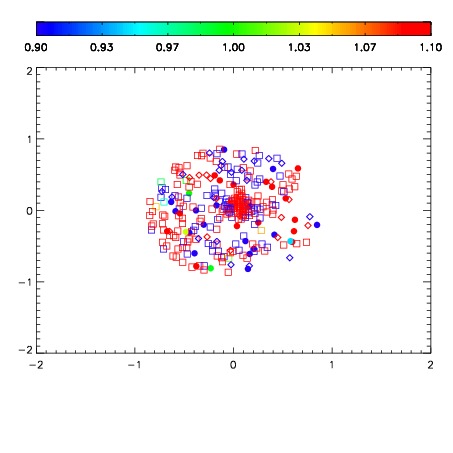
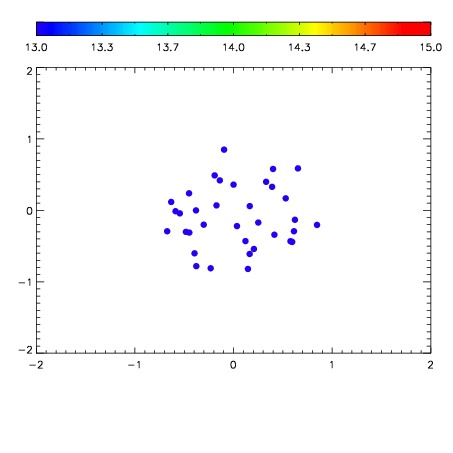

| Frame | Nreads | Zeropoints | Mag plots | Spatial mag deviation | Spatial sky 16325A emission deviations (filled: sky, open: star) | Spatial sky continuum emission | Spatial sky telluric CO2 absorption deviations (filled: H < 10) | |||||||||||||||||||||||
| 0 | 0 |
|
|
|
|
|
|
| IPAIR | NAME | SHIFT | NEWSHIFT | S/N | NAME | SHIFT | NEWSHIFT | S/N |
| 0 | 06050013 | 0.484093 | 0.00000 | 148.817 | 06050014 | 0.00219382 | 0.481899 | 145.292 |
| 1 | 06050012 | 0.483981 | 0.000111997 | 160.611 | 06050011 | 0.00000 | 0.484093 | 160.924 |
| 2 | 06050016 | 0.481880 | 0.00221300 | 113.944 | 06050015 | 0.00144946 | 0.482644 | 138.033 |
| 3 | 06050017 | 0.483144 | 0.000949025 | 100.714 | 06050018 | 0.00247196 | 0.481621 | 82.8691 |