| Red | Green | Blue | |
| z | 17.63 | ||
| znorm | Inf | ||
| sky | -NaN | -NaN | -NaN |
| S/N | 14.2 | 25.7 | 26.4 |
| S/N(c) | 0.0 | 0.0 | 0.0 |
| SN(E/C) |
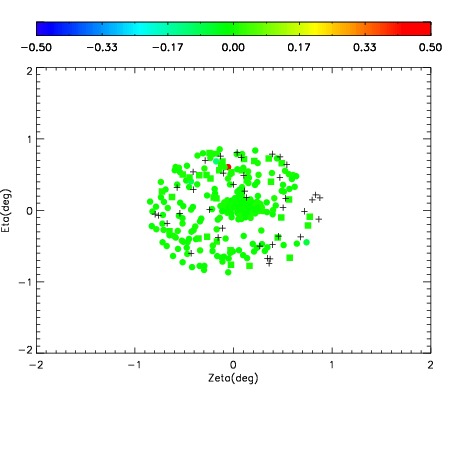
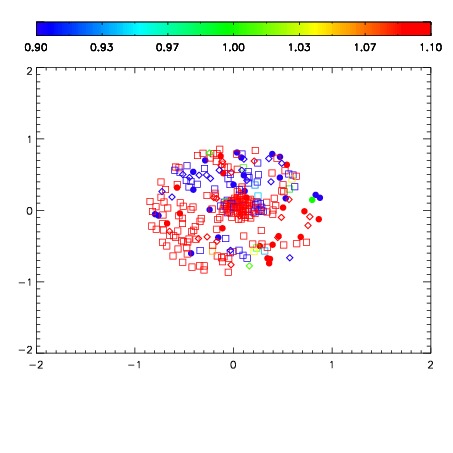
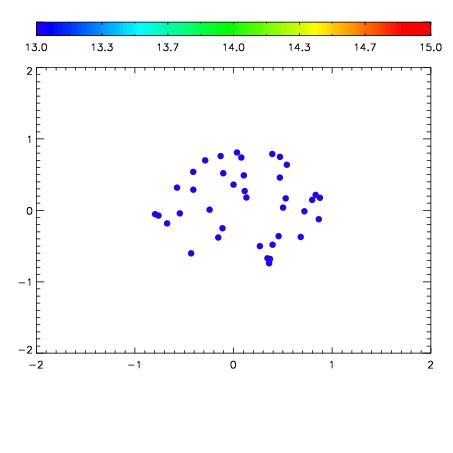

| Frame | Nreads | Zeropoints | Mag plots | Spatial mag deviation | Spatial sky 16325A emission deviations (filled: sky, open: star) | Spatial sky continuum emission | Spatial sky telluric CO2 absorption deviations (filled: H < 10) | |||||||||||||||||||||||
| 0 | 0 |
|
|
|
|
|
|
| IPAIR | NAME | SHIFT | NEWSHIFT | S/N | NAME | SHIFT | NEWSHIFT | S/N |
| 0 | 06070012 | 0.482298 | 0.00000 | 128.787 | 06070017 | 0.000748544 | 0.481549 | 127.014 |
| 1 | 06070011 | 0.481643 | 0.000654995 | 140.231 | 06070010 | 0.00000 | 0.482298 | 135.824 |
| 2 | 06070016 | 0.479797 | 0.00250098 | 133.209 | 06070014 | 0.000358888 | 0.481939 | 131.810 |
| 3 | 06070015 | 0.480255 | 0.00204298 | 126.834 | 06070013 | 0.00247499 | 0.479823 | 123.294 |