| Red | Green | Blue | |
| z | 17.63 | ||
| znorm | Inf | ||
| sky | -NaN | -NaN | -NaN |
| S/N | 14.2 | 25.8 | 26.9 |
| S/N(c) | 0.0 | 0.0 | 0.0 |
| SN(E/C) |
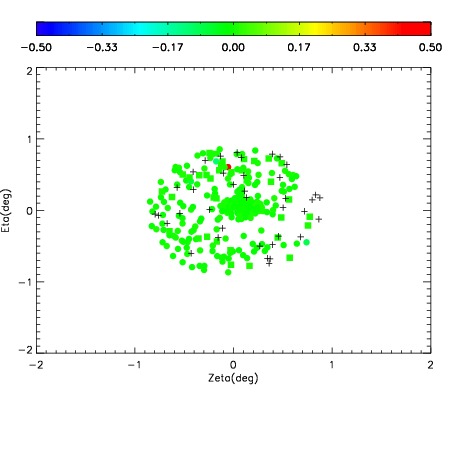
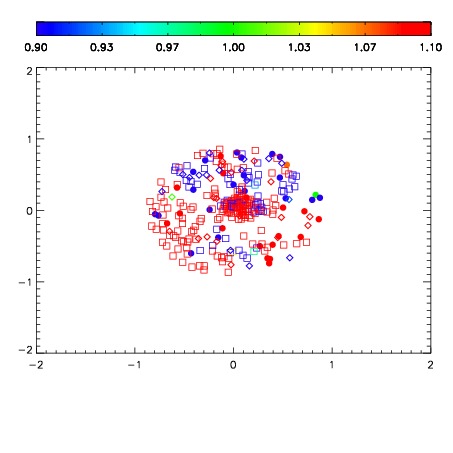
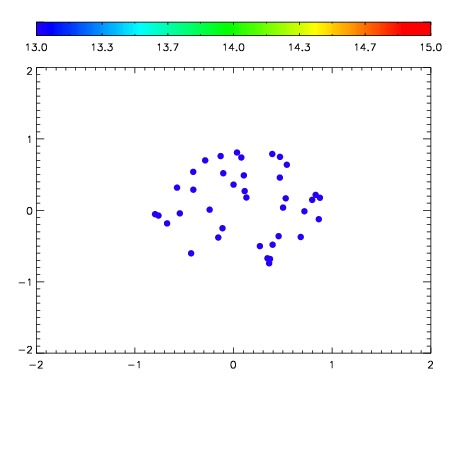

| Frame | Nreads | Zeropoints | Mag plots | Spatial mag deviation | Spatial sky 16325A emission deviations (filled: sky, open: star) | Spatial sky continuum emission | Spatial sky telluric CO2 absorption deviations (filled: H < 10) | |||||||||||||||||||||||
| 0 | 0 |
|
|
|
|
|
|
| IPAIR | NAME | SHIFT | NEWSHIFT | S/N | NAME | SHIFT | NEWSHIFT | S/N |
| 0 | 06080011 | 0.481925 | 0.00000 | 136.264 | 06080014 | -0.000865216 | 0.482790 | 129.102 |
| 1 | 06080012 | 0.481887 | 3.79980e-05 | 144.333 | 06080013 | 0.000591104 | 0.481334 | 131.380 |
| 2 | 06080016 | 0.481127 | 0.000798017 | 131.713 | 06080017 | -0.000335945 | 0.482261 | 127.548 |
| 3 | 06080015 | 0.480991 | 0.000934005 | 124.547 | 06080010 | 0.00000 | 0.481925 | 120.436 |