| Red | Green | Blue | |
| z | 17.64 | ||
| znorm | Inf | ||
| sky | -NaN | -NaN | -NaN |
| S/N | 24.2 | 33.6 | 33.0 |
| S/N(c) | 0.0 | 0.0 | 0.0 |
| SN(E/C) |

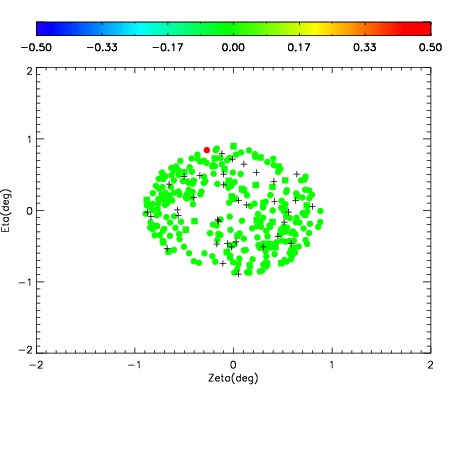
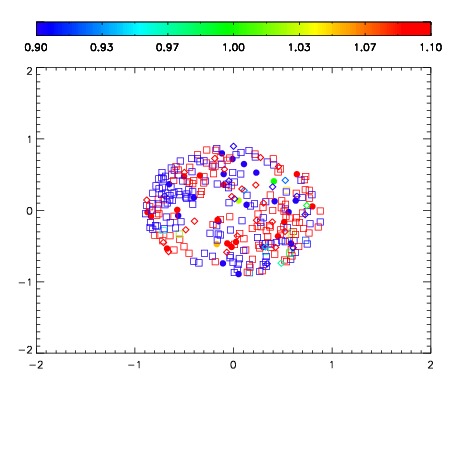
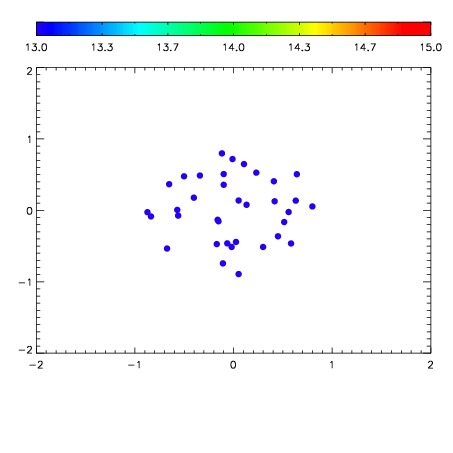

| Frame | Nreads | Zeropoints | Mag plots | Spatial mag deviation | Spatial sky 16325A emission deviations (filled: sky, open: star) | Spatial sky continuum emission | Spatial sky telluric CO2 absorption deviations (filled: H < 10) | |||||||||||||||||||||||
| 0 | 0 |
|
|
|
|
|
|
| IPAIR | NAME | SHIFT | NEWSHIFT | S/N | NAME | SHIFT | NEWSHIFT | S/N |
| 0 | 08360146 | 0.524847 | 0.00000 | 161.423 | 08360148 | 0.00138428 | 0.523463 | 162.901 |
| 1 | 08360145 | 0.524150 | 0.000696957 | 172.264 | 08360144 | 0.00000 | 0.524847 | 176.656 |
| 2 | 08360149 | 0.519371 | 0.00547600 | 171.033 | 08360147 | 0.00238853 | 0.522458 | 166.764 |