| Red | Green | Blue | |
| z | 17.64 | ||
| znorm | Inf | ||
| sky | -NaN | -NaN | -Inf |
| S/N | 25.4 | 37.5 | 39.4 |
| S/N(c) | 0.0 | 0.0 | 0.0 |
| SN(E/C) |
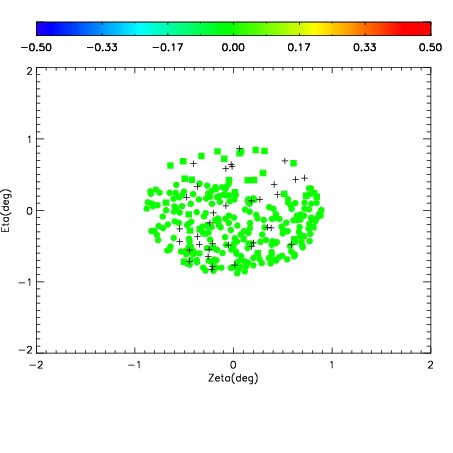


| Frame | Nreads | Zeropoints | Mag plots | Spatial mag deviation | Spatial sky 16325A emission deviations (filled: sky, open: star) | Spatial sky continuum emission | Spatial sky telluric CO2 absorption deviations (filled: H < 10) | |||||||||||||||||||||||
| 0 | 0 |
|
|
|
|
|
|
| IPAIR | NAME | SHIFT | NEWSHIFT | S/N | NAME | SHIFT | NEWSHIFT | S/N |
| 0 | 04680084 | 0.497424 | 0.00000 | 173.157 | 04680081 | -0.000470208 | 0.497894 | 136.429 |
| 1 | 04680079 | 0.493874 | 0.00354999 | 193.121 | 04680078 | 0.00000 | 0.497424 | 196.610 |
| 2 | 04680080 | 0.495028 | 0.00239602 | 180.994 | 04680082 | -0.00110769 | 0.498532 | 169.375 |
| 3 | 04680083 | 0.497011 | 0.000413001 | 180.694 | 04680085 | -0.00194060 | 0.499365 | 145.877 |