| Red | Green | Blue | |
| z | 17.64 | ||
| znorm | Inf | ||
| sky | -NaN | -NaN | -Inf |
| S/N | 27.6 | 40.0 | 41.4 |
| S/N(c) | 0.0 | 0.0 | 0.0 |
| SN(E/C) |
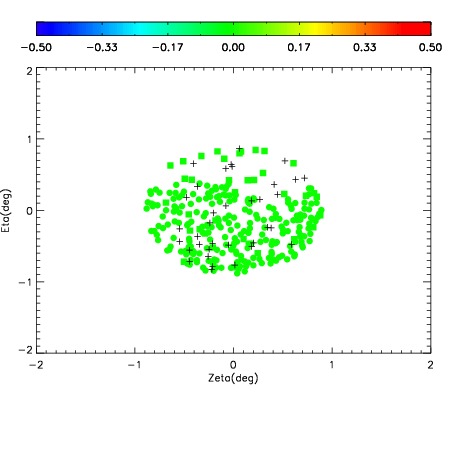
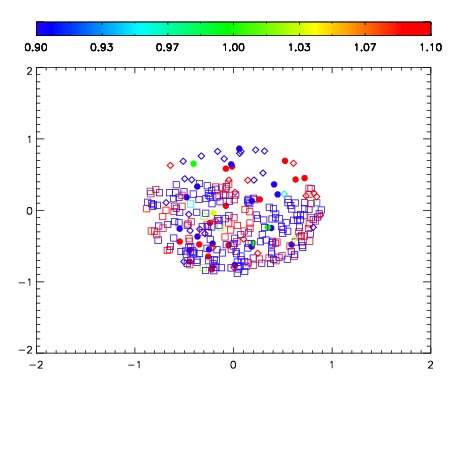
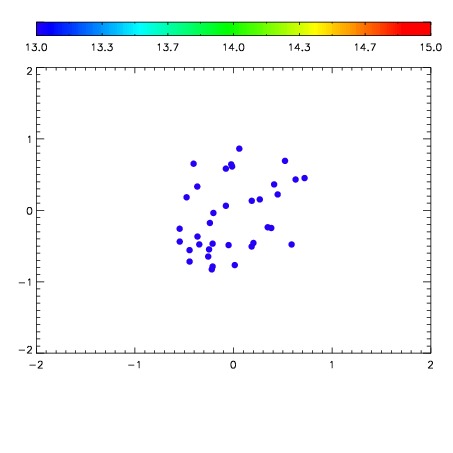

| Frame | Nreads | Zeropoints | Mag plots | Spatial mag deviation | Spatial sky 16325A emission deviations (filled: sky, open: star) | Spatial sky continuum emission | Spatial sky telluric CO2 absorption deviations (filled: H < 10) | |||||||||||||||||||||||
| 0 | 0 |
|
|
|
|
|
|
| IPAIR | NAME | SHIFT | NEWSHIFT | S/N | NAME | SHIFT | NEWSHIFT | S/N |
| 0 | 04710012 | 0.497555 | 0.00000 | 193.120 | 04710014 | 0.000776715 | 0.496778 | 197.478 |
| 1 | 04710015 | 0.495278 | 0.00227699 | 197.493 | 04710010 | 0.00000 | 0.497555 | 203.814 |
| 2 | 04710011 | 0.496647 | 0.000907987 | 195.581 | 04710013 | 0.00217153 | 0.495383 | 200.155 |