| Red | Green | Blue | |
| z | 17.64 | ||
| znorm | Inf | ||
| sky | -NaN | -Inf | -Inf |
| S/N | 27.8 | 40.5 | 43.2 |
| S/N(c) | 0.0 | 0.0 | 0.0 |
| SN(E/C) |
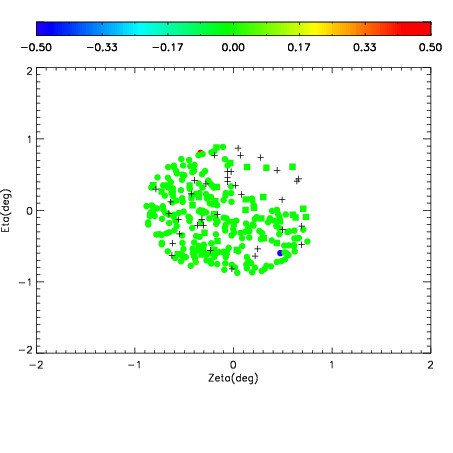
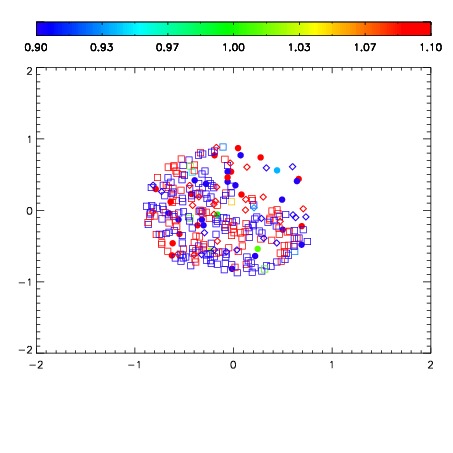
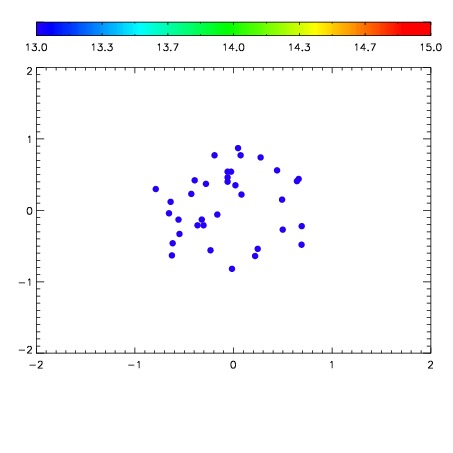

| Frame | Nreads | Zeropoints | Mag plots | Spatial mag deviation | Spatial sky 16325A emission deviations (filled: sky, open: star) | Spatial sky continuum emission | Spatial sky telluric CO2 absorption deviations (filled: H < 10) | |||||||||||||||||||||||
| 0 | 0 |
|
|
|
|
|
|
| IPAIR | NAME | SHIFT | NEWSHIFT | S/N | NAME | SHIFT | NEWSHIFT | S/N |
| 0 | 08820016 | 0.481254 | 0.00000 | 160.757 | 08820014 | -0.00139781 | 0.482652 | 164.031 |
| 1 | 08820017 | 0.481246 | 8.01682e-06 | 170.324 | 08820018 | 0.00150274 | 0.479751 | 187.401 |
| 2 | 08820012 | 0.477934 | 0.00332001 | 146.984 | 08820015 | -0.000613060 | 0.481867 | 163.259 |
| 3 | 08820013 | 0.478594 | 0.00266001 | 146.330 | 08820011 | 0.00000 | 0.481254 | 130.218 |