| Red | Green | Blue | |
| z | 17.64 | ||
| znorm | Inf | ||
| sky | -Inf | -Inf | -Inf |
| S/N | 24.3 | 34.6 | 36.9 |
| S/N(c) | 0.0 | 0.0 | 0.0 |
| SN(E/C) |
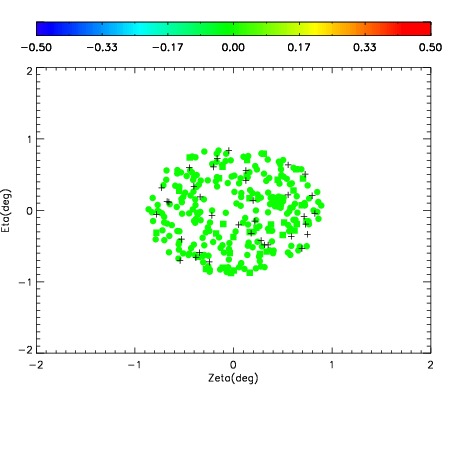
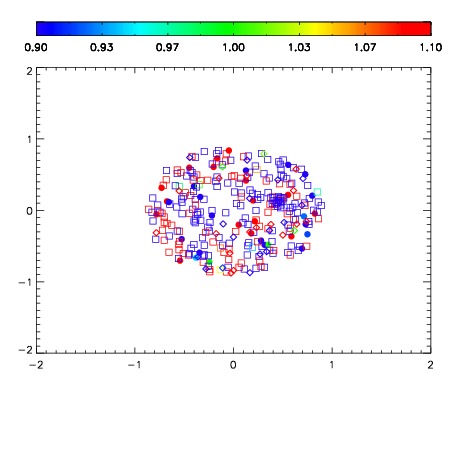
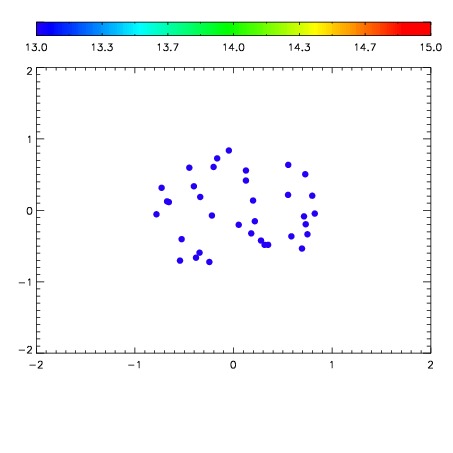

| Frame | Nreads | Zeropoints | Mag plots | Spatial mag deviation | Spatial sky 16325A emission deviations (filled: sky, open: star) | Spatial sky continuum emission | Spatial sky telluric CO2 absorption deviations (filled: H < 10) | |||||||||||||||||||||||
| 0 | 0 |
|
|
|
|
|
|
| IPAIR | NAME | SHIFT | NEWSHIFT | S/N | NAME | SHIFT | NEWSHIFT | S/N |
| 0 | 08460118 | 0.489052 | 0.00000 | 167.911 | 08460120 | 0.00159655 | 0.487455 | 205.417 |
| 1 | 08460121 | 0.487254 | 0.00179800 | 226.229 | 08460116 | 0.00000 | 0.489052 | 213.702 |
| 2 | 08460117 | 0.486315 | 0.00273699 | 185.817 | 08460119 | 0.00399031 | 0.485062 | 209.229 |