| Red | Green | Blue | |
| z | 17.64 | ||
| znorm | Inf | ||
| sky | -Inf | -Inf | -Inf |
| S/N | 30.9 | 44.8 | 48.2 |
| S/N(c) | 0.0 | 0.0 | 0.0 |
| SN(E/C) |
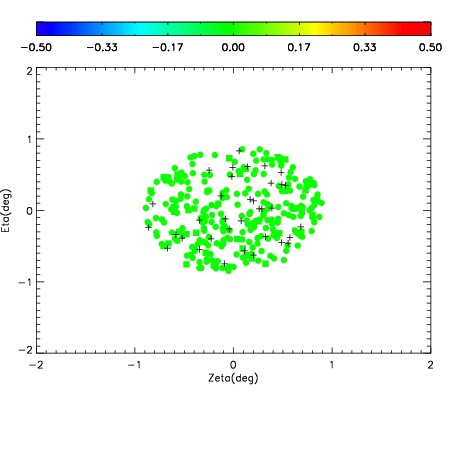
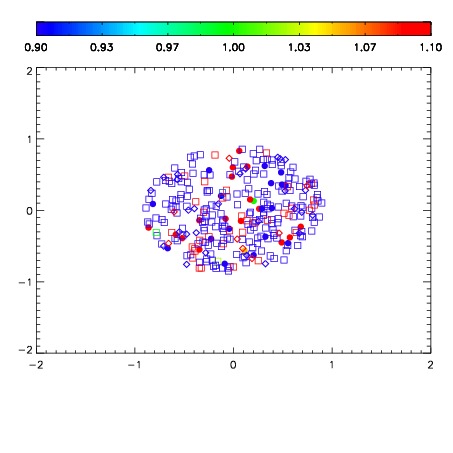


| Frame | Nreads | Zeropoints | Mag plots | Spatial mag deviation | Spatial sky 16325A emission deviations (filled: sky, open: star) | Spatial sky continuum emission | Spatial sky telluric CO2 absorption deviations (filled: H < 10) | |||||||||||||||||||||||
| 0 | 0 |
|
|
|
|
|
|
| IPAIR | NAME | SHIFT | NEWSHIFT | S/N | NAME | SHIFT | NEWSHIFT | S/N |
| 0 | 08410083 | 0.500140 | 0.00000 | 204.344 | 08410084 | 0.000783454 | 0.499357 | 203.117 |
| 1 | 08410086 | 0.483978 | 0.0161620 | 207.543 | 08410085 | 0.000897874 | 0.499242 | 207.881 |
| 2 | 08410087 | 0.484714 | 0.0154260 | 207.397 | 08410088 | -0.0125725 | 0.512713 | 206.008 |
| 3 | 08410082 | 0.499795 | 0.000345021 | 193.923 | 08410081 | 0.00000 | 0.500140 | 191.515 |