| Red | Green | Blue | |
| z | 17.64 | ||
| znorm | Inf | ||
| sky | -NaN | -NaN | -Inf |
| S/N | 26.9 | 40.0 | 41.4 |
| S/N(c) | 0.0 | 0.0 | 0.0 |
| SN(E/C) |
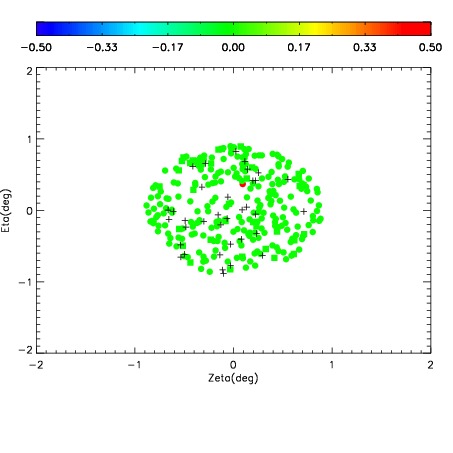
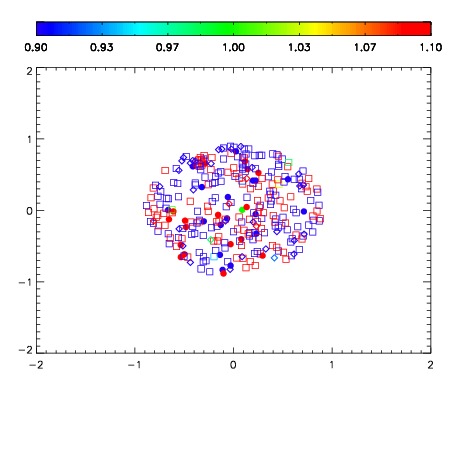
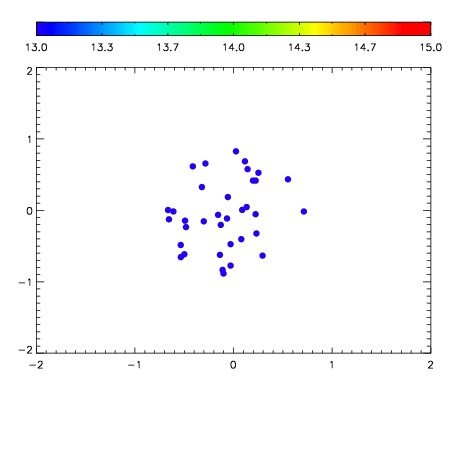

| Frame | Nreads | Zeropoints | Mag plots | Spatial mag deviation | Spatial sky 16325A emission deviations (filled: sky, open: star) | Spatial sky continuum emission | Spatial sky telluric CO2 absorption deviations (filled: H < 10) | |||||||||||||||||||||||
| 0 | 0 |
|
|
|
|
|
|
| IPAIR | NAME | SHIFT | NEWSHIFT | S/N | NAME | SHIFT | NEWSHIFT | S/N |
| 0 | 12090072 | 0.490161 | 0.00000 | 178.938 | 12090074 | -0.00338061 | 0.493542 | 183.553 |
| 1 | 12090076 | 0.486606 | 0.00355500 | 191.738 | 12090075 | -0.00352007 | 0.493681 | 188.432 |
| 2 | 12090073 | 0.489895 | 0.000266016 | 178.929 | 12090071 | 0.00000 | 0.490161 | 176.078 |