| Red | Green | Blue | |
| z | 17.64 | ||
| znorm | Inf | ||
| sky | -Inf | -Inf | -Inf |
| S/N | 24.8 | 36.1 | 38.5 |
| S/N(c) | 0.0 | 0.0 | 0.0 |
| SN(E/C) |
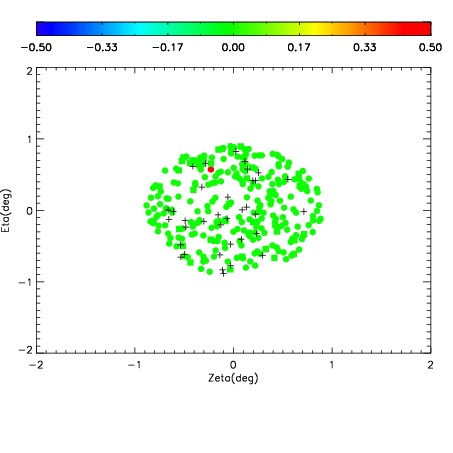
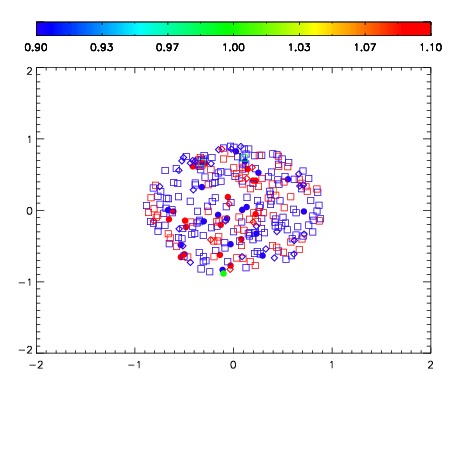
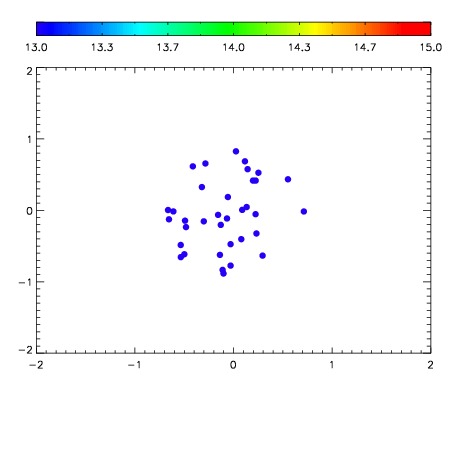

| Frame | Nreads | Zeropoints | Mag plots | Spatial mag deviation | Spatial sky 16325A emission deviations (filled: sky, open: star) | Spatial sky continuum emission | Spatial sky telluric CO2 absorption deviations (filled: H < 10) | |||||||||||||||||||||||
| 0 | 0 |
|
|
|
|
|
|
| IPAIR | NAME | SHIFT | NEWSHIFT | S/N | NAME | SHIFT | NEWSHIFT | S/N |
| 0 | 12330046 | 0.494263 | 0.00000 | 108.787 | 12330044 | 0.00000 | 0.494263 | 100.046 |
| 1 | 12330049 | 0.489719 | 0.00454399 | 198.423 | 12330048 | -0.00390051 | 0.498163 | 196.926 |
| 2 | 12330050 | 0.491860 | 0.00240299 | 159.565 | 12330047 | -0.00341319 | 0.497676 | 196.225 |
| 3 | 12330045 | 0.492350 | 0.00191298 | 118.668 | 12330051 | 0.00107082 | 0.493192 | 178.530 |