| Red | Green | Blue | |
| z | 17.64 | ||
| znorm | Inf | ||
| sky | -Inf | -Inf | -Inf |
| S/N | 34.5 | 50.7 | 55.4 |
| S/N(c) | 0.0 | 0.0 | 0.0 |
| SN(E/C) |
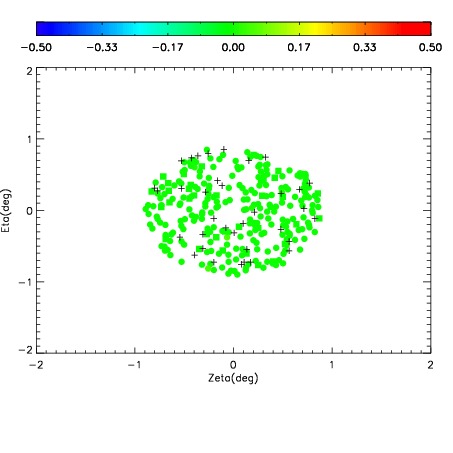
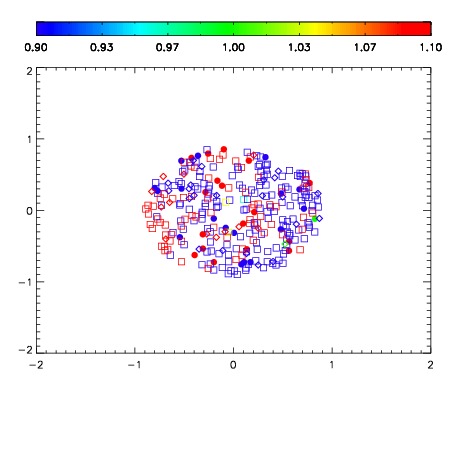
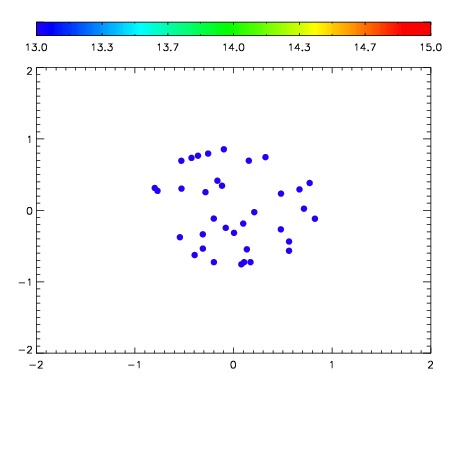

| Frame | Nreads | Zeropoints | Mag plots | Spatial mag deviation | Spatial sky 16325A emission deviations (filled: sky, open: star) | Spatial sky continuum emission | Spatial sky telluric CO2 absorption deviations (filled: H < 10) | |||||||||||||||||||||||
| 0 | 0 |
|
|
|
|
|
|
| IPAIR | NAME | SHIFT | NEWSHIFT | S/N | NAME | SHIFT | NEWSHIFT | S/N |
| 0 | 04600086 | 0.496250 | 0.00000 | 236.560 | 04600087 | 9.29835e-05 | 0.496157 | 233.891 |
| 1 | 04600085 | 0.494525 | 0.00172502 | 224.792 | 04600080 | 0.00000 | 0.496250 | 225.536 |
| 2 | 04600082 | 0.495589 | 0.000661016 | 221.283 | 04600084 | -0.000983582 | 0.497234 | 220.235 |
| 3 | 04600081 | 0.495156 | 0.00109401 | 216.523 | 04600083 | 0.000146818 | 0.496103 | 215.336 |